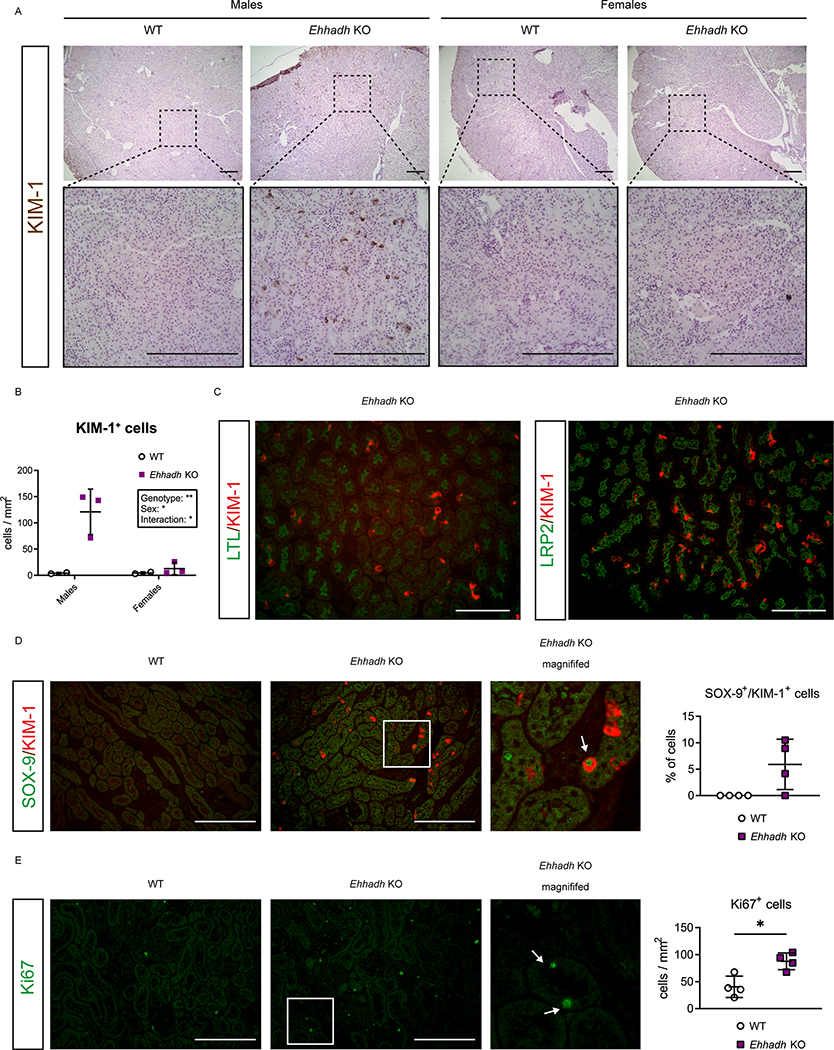
Figure 3. EHHADH deficiency activates the proximal tubule injury response in male mice.
A) Representative images of KIM-1 IHC in the cortical area of WT and Ehhadh KO mouse kidneys (n=3–4 per sex and genotype). Upper panels: 4x objective. Lower panels: 20x objective. B) Quantification of KIM-1+ cells per mm2 in WT and Ehhadh KO male and female mice. C) Representative images of double IF of KIM-1 with pan-tubular markers (LTL and LRP2) in the kidneys of Ehhadh KO male mice. There was no KIM-1 signal in male WT mice or female WT and Ehhadh KO mice (not shown). D) Representative images of double IF of KIM-1 (red) and SOX-9 (green) in WT and Ehhadh KO male mice (n=4). Inset shows expanded region of the Ehhadh KO section. White arrow points to a double positive Sox9+/Kim-1+ cell. Graph shows quantification of double positive SOX-9+/KIM-1+ cells in WT and Ehhadh KO mice. E) Representative images of Ki67 IF (green) in WT and Ehhadh KO male mice (n=4). Inset shows expanded region of the Ehhadh KO section. White arrows point to Ki67+-cells. Graph shows quantification of Ki67+ cells per mm2 in WT and Ehhadh KO mice. Data are presented as mean ± SD with individual values plotted (D, E). Statistical significance was tested using unpaired t test with Welch’s correction (D, E). *P < 0.05. Scale bar = 250 μm (A), 100 μm (C-E).

