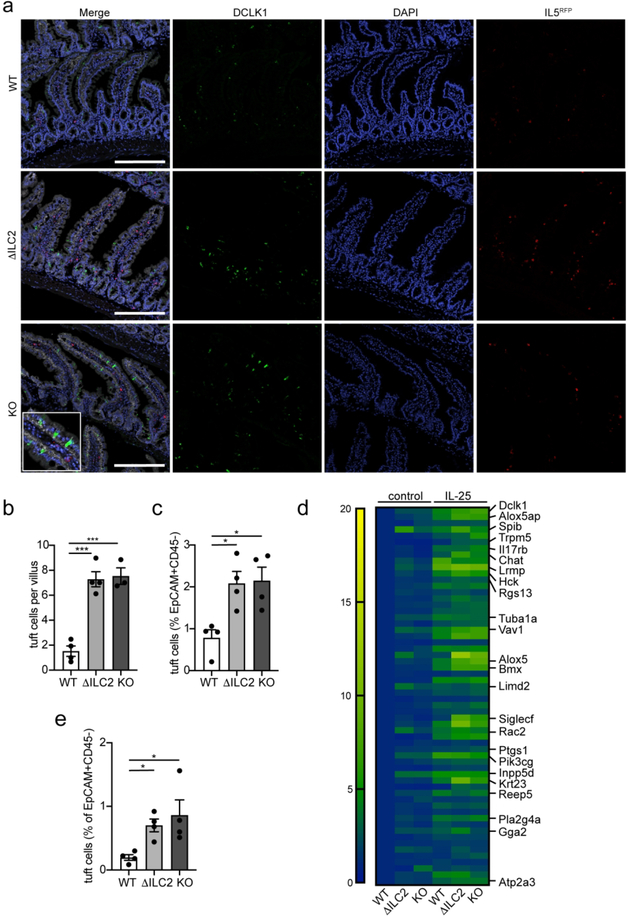
Figure 3: Loss of CISH in ILC2s leads to an increase in intestinal tuft cells.
a. Representative images of small intestine from indicated strains of mice sacrificed on day 4 following 3 daily doses of i.p. IL-25 treatment. EpCAM (white), DCLK1 (green), IL5RFP+ ILC2s (red), DAPI (blue). Scale bars represent 200 μm.
b. Quantification of tuft cell numbers per villus as shown by immunofluorescence in (a). ***p<0.001 for one-way ANOVA with Dunnett testing for multiple comparisons. n=3–4 mice/group.
c. Flow cytometric quantification of tuft cells (DCLK1+, EpCAM+, CD44−, CD45−, live cells) in epithelial fraction of jejunum of IL-25-treated mice. *p<0.05 for one-way ANOVA with Dunnett testing for multiple comparisons. n=4 mice/group.
d. Heatmap of tuft cell consensus signature in untreated or IL-25-treated mice of indicated genotypes. Each block represents row-normalized mean expression of 3 mice/group.
e. Flow cytometric quantification of tuft cells (DCLK1+, EpCAM+, CD44−, CD45−, live cells) in epithelial fraction of jejunum of untreated mice by flow cytometry. *p<0.05 for one-way ANOVA with Dunnett testing for multiple comparisons. n=4 mice/group. Representative of 3 similar experiments.

