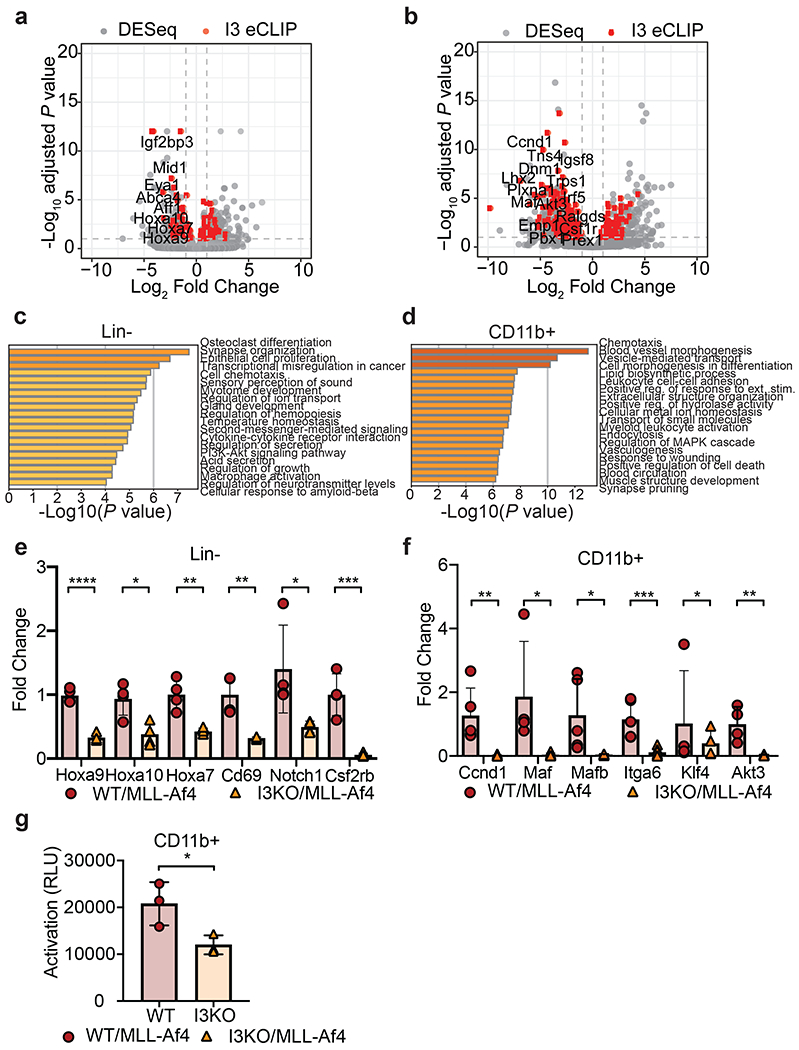
Figure 5: IGF2BP3 enhances MLL-Af4 mediated leukemogenesis through targeting transcripts within leukemogenic and Ras signaling pathways.

a) Volcano plot of differentially expressed genes determined using DESeq analysis on RNA-seq samples from WT/MLL-Af4 or I3KO/MLL-Af4 Lin- cells. Dotted lines represent 1.0-fold–change in expression (vertical lines) and adjusted P < 0.1 cutoff (horizontal line). IGF2BP3 eCLIP-seq targets are highlighted in red.
b) Volcano plot of differentially expressed transcripts determined using DESeq analysis on RNA-seq samples from WT/MLL-Af4 or I3KO/MLL-Af4 CD11b+ cells. Dotted lines represent 1.0-fold–change in expression (vertical lines) and adjusted P < 0.1 cutoff (horizontal line). IGF2BP3 eCLIP-seq targets are highlighted in red.
c) GO Biological Processes and KEGG Pathway enrichment determined utilizing the Metascape enrichment analysis webtool on MLL-Af4 Lin- IGF2BP3 DESeq dataset with an adjusted P < 0.05 cutoff.
d) GO Biological Processes and KEGG Pathway enrichment determined utilizing the Metascape enrichment analysis webtool on MLL-Af4 CD11b+ IGF2BP3 DESeq dataset with an adjusted P < 0.05 cutoff. Bar graphs are ranked by P value and overlap of terms within gene list.
e) Expression of leukemogenic target genes in WT/MLL-Af4 and I3KO/MLL-Af4 Lin- cells by RT-qPCR (n= 4; t-test; *P < 0.05, **P < 0.01, ****P < 0.0001).
f) Expression of Ras signaling pathway genes in WT/MLL-Af4 and I3KO/MLL-Af4 CD11b+ cells by RT-qPCR (n=4; t-test; *P < 0.05, **P < 0.01, ***P < 0.001).
g) Ras GTPase activity by ELISA in WT/MLL-Af4 and I3KO/MLL-Af4 CD11b+ cells (n=3; t-test; *P < 0.05).
