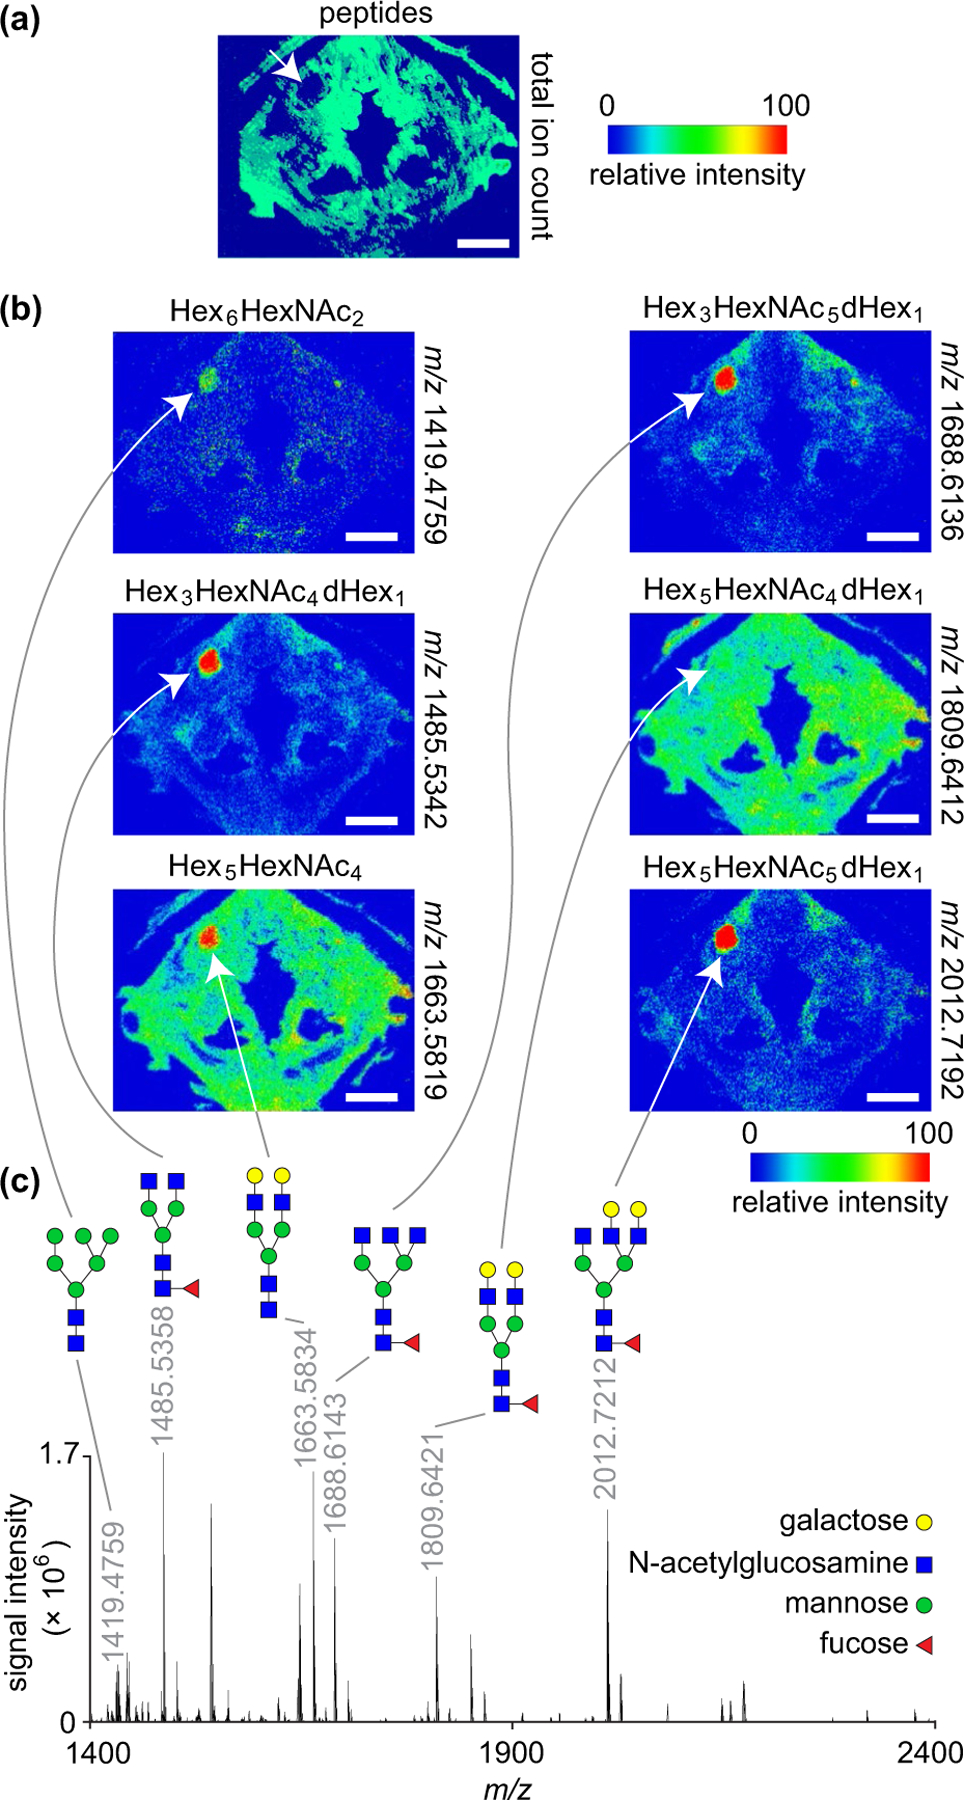
FIGURE 6.

MALDI-MS imaging and glycomic analysis of a mucus retention cyst. (a) Total ion count map from a peptide acquisition run showing the spatial distribution of summed peptide intensities. The white arrow denotes the lesion and shows no peptide signal in this region. The donor was a 74-year-old female. (b) Ion maps from a glycan acquisition run showing the spatial distribution of six N-glycans identified throughout the lesion. White arrows denote the lesion. (c) Representative mass spectrum acquired from the lesion region. The annotated peaks correspond to the ion maps in panel (b). N-glycan structures are depicted using the Symbol Nomenclature for Glycans (SNFG) format; note that the identified glycans are all in the sodiated adduct form as [M + Na]+. MALDI-MS, matrix-assisted laser desorption/ionisation-mass spectrometry; m/z, mass-to-charge ratio. Scale bars, 5 mm
