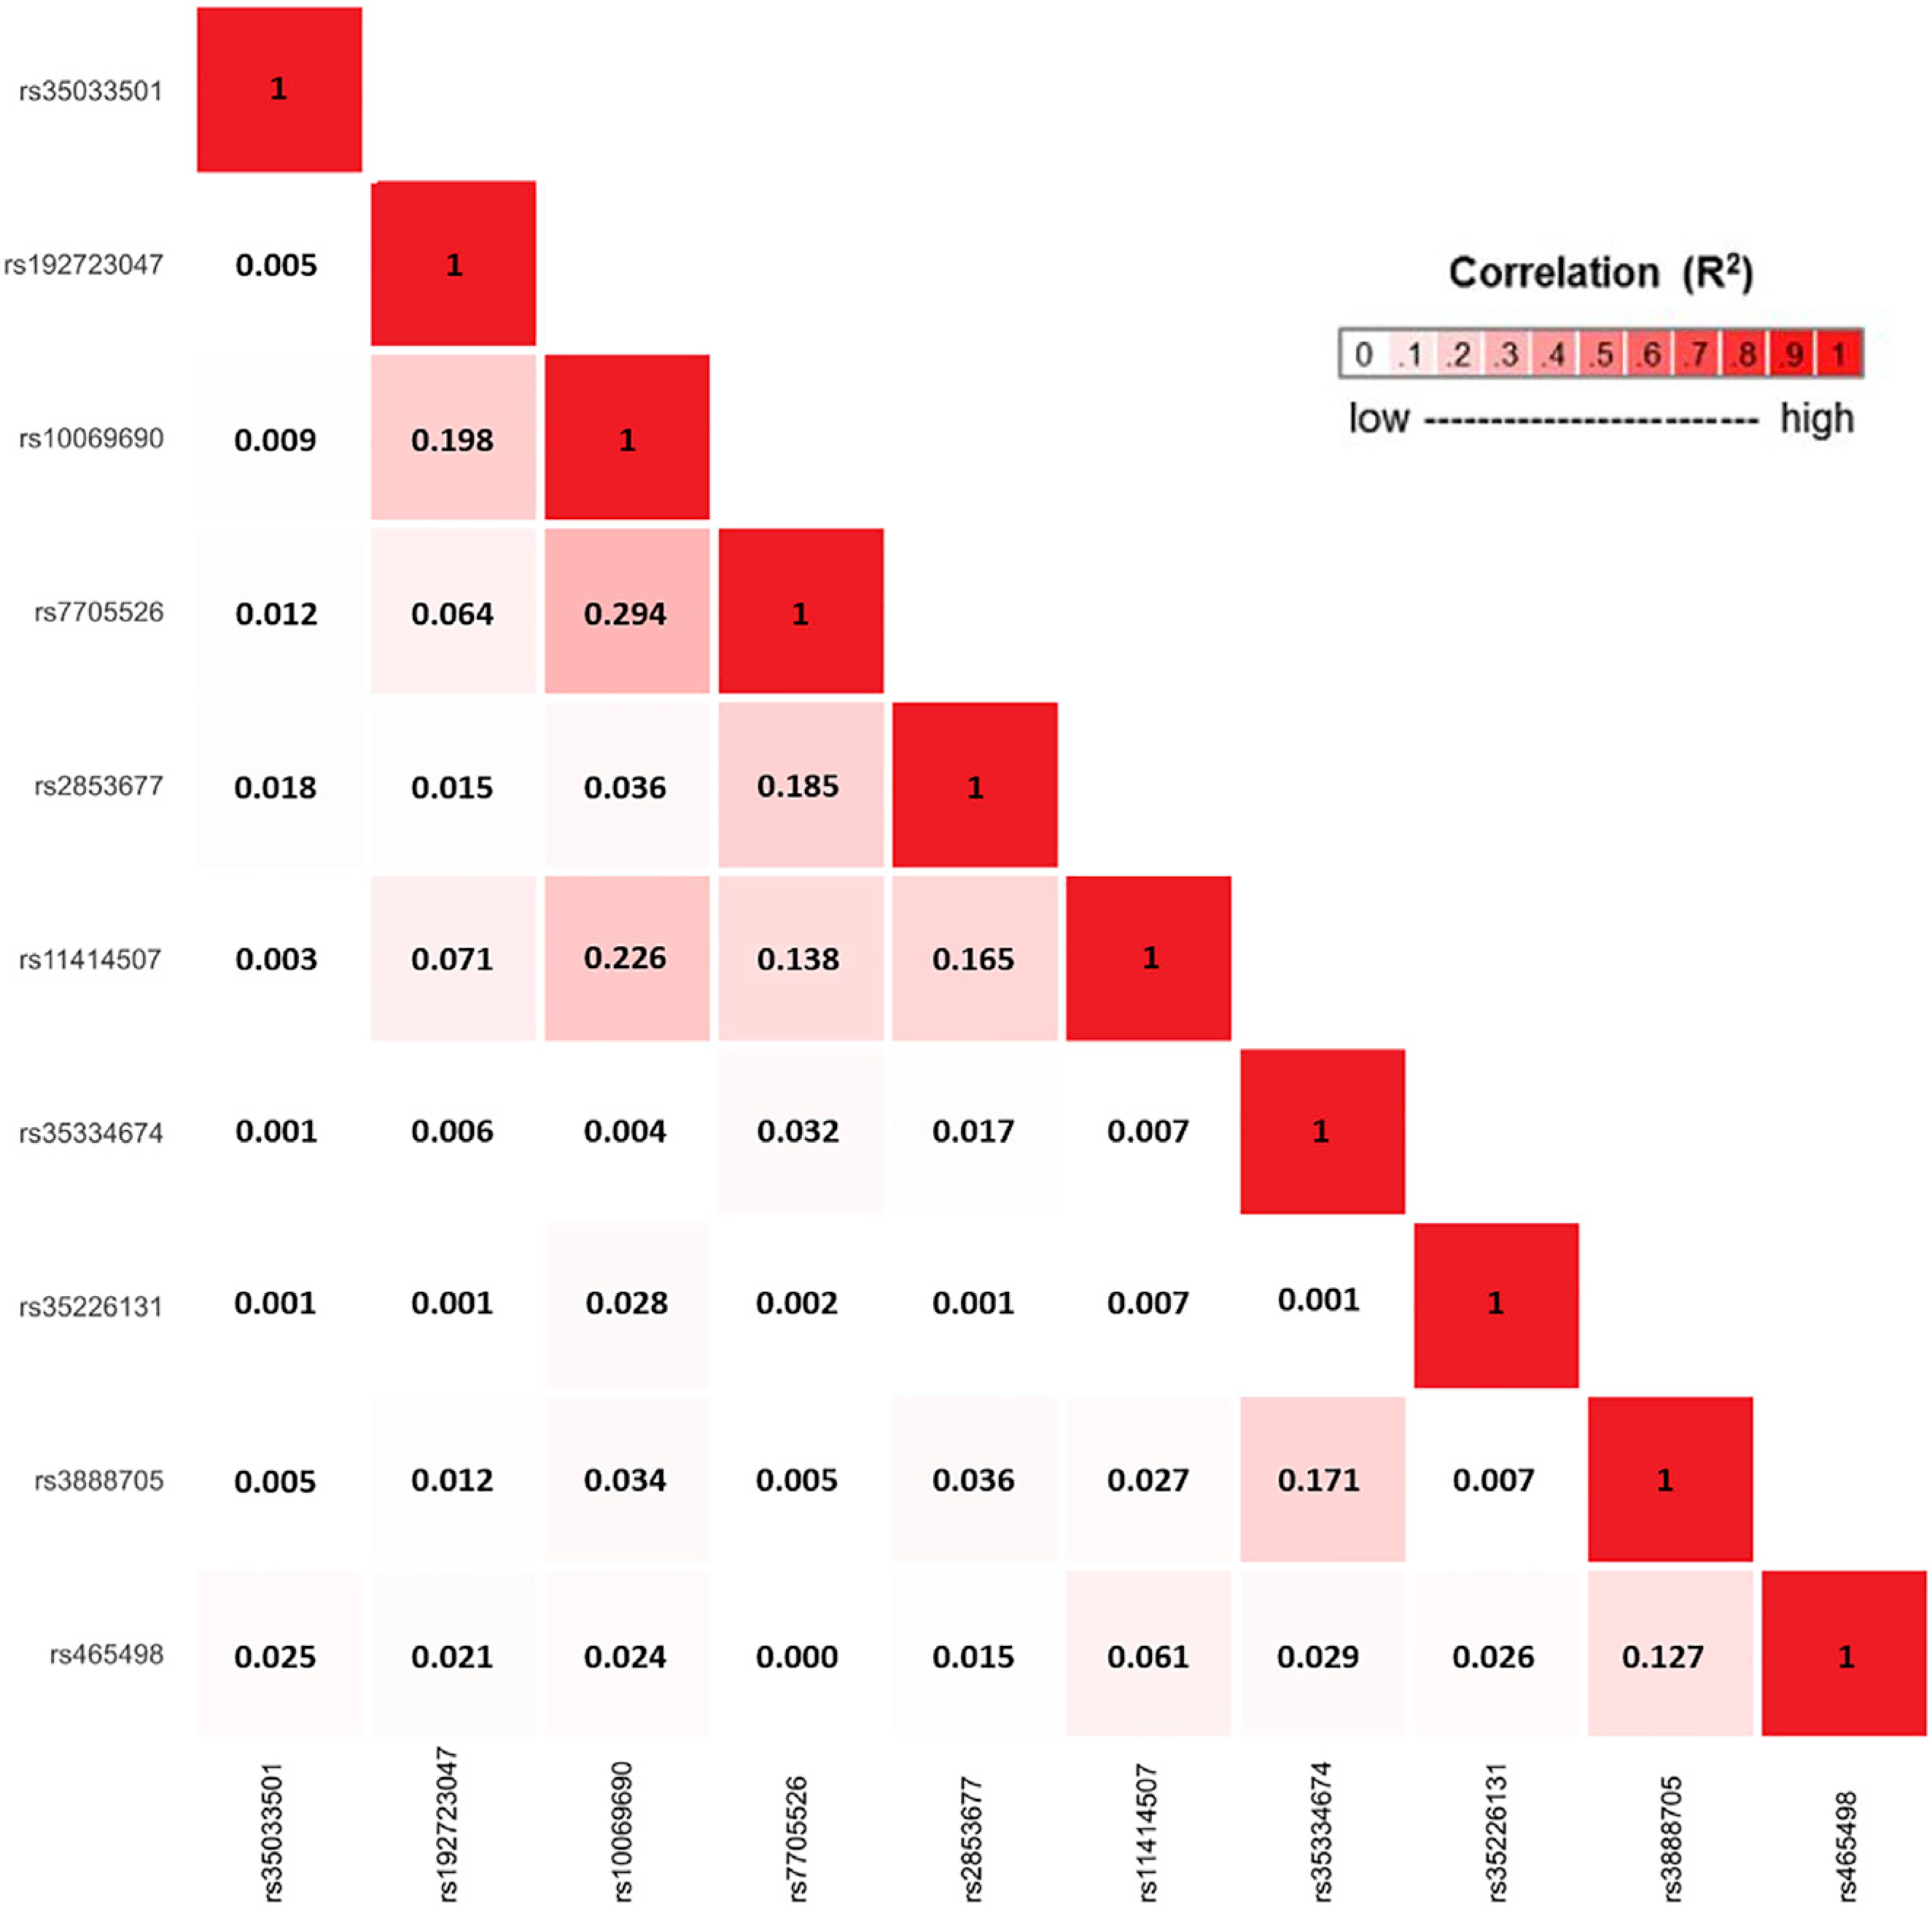
Figure 5. Correlation matrix showing the pairwise linkage disequilibrium (LD) between 10 candidate signals, identified using an iterative COJO-ASSET analysis.

LD was calculated based on the European ancestry populations in 1000 Genomes (1000G) Project.
