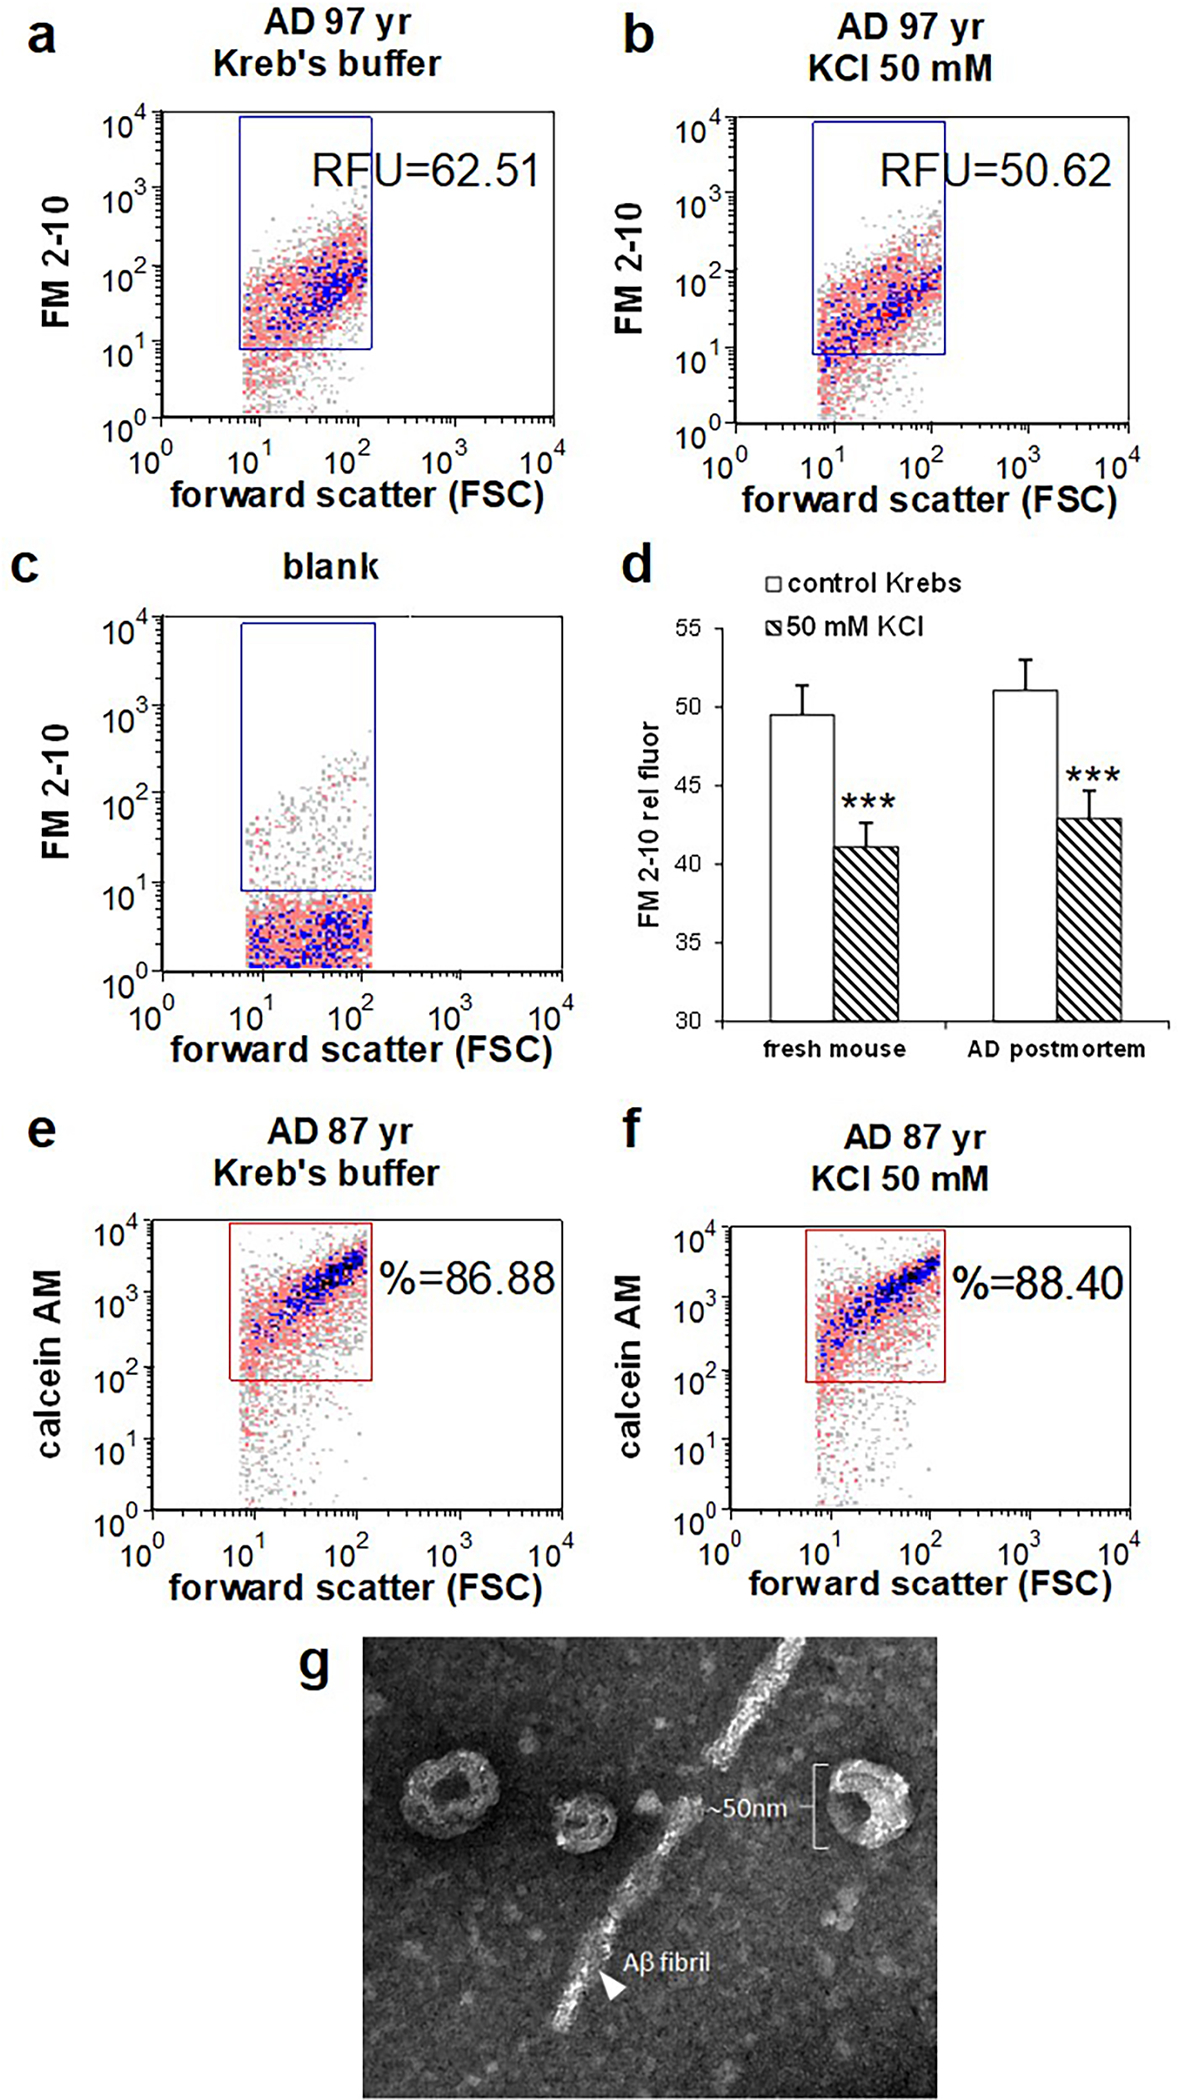
Figure 1. Flow cytometry assay for in vitro quantification of depolarization.

AD cortical synaptosomes were incubated with FM2–10 (25μM) prior to incubation with KCl (30mM) and flow cytometry analysis (a,b) Representative density plots illustrate FM2–10 labeling in baseline (a) and depolarized samples (b); reduction in fluorescence corresponds to exocytic activity. Forward scatter (FSC) is proportional to particle size; rectangular analysis gate is drawn on size standard to include particles from ~0.5–1.5 μm, data collected from 5000 events. (c) Background labeling in unstained blank. (d) Aggregate data from human AD cortex (A7 or A9; n=13) and fresh mouse cortex (n=12; p<0.0001). (e) representative density plots illustrate viability dye calcein AM, showing integrity of baseline (e) and depolarized (f) P-2 samples. (g) AD release supernatant was concentrated as described in Methods for transmission electron microscopy.
