
Figure 5. Silica and LPS exert similar effects on glucose uptake and glycolysis in macrophages.
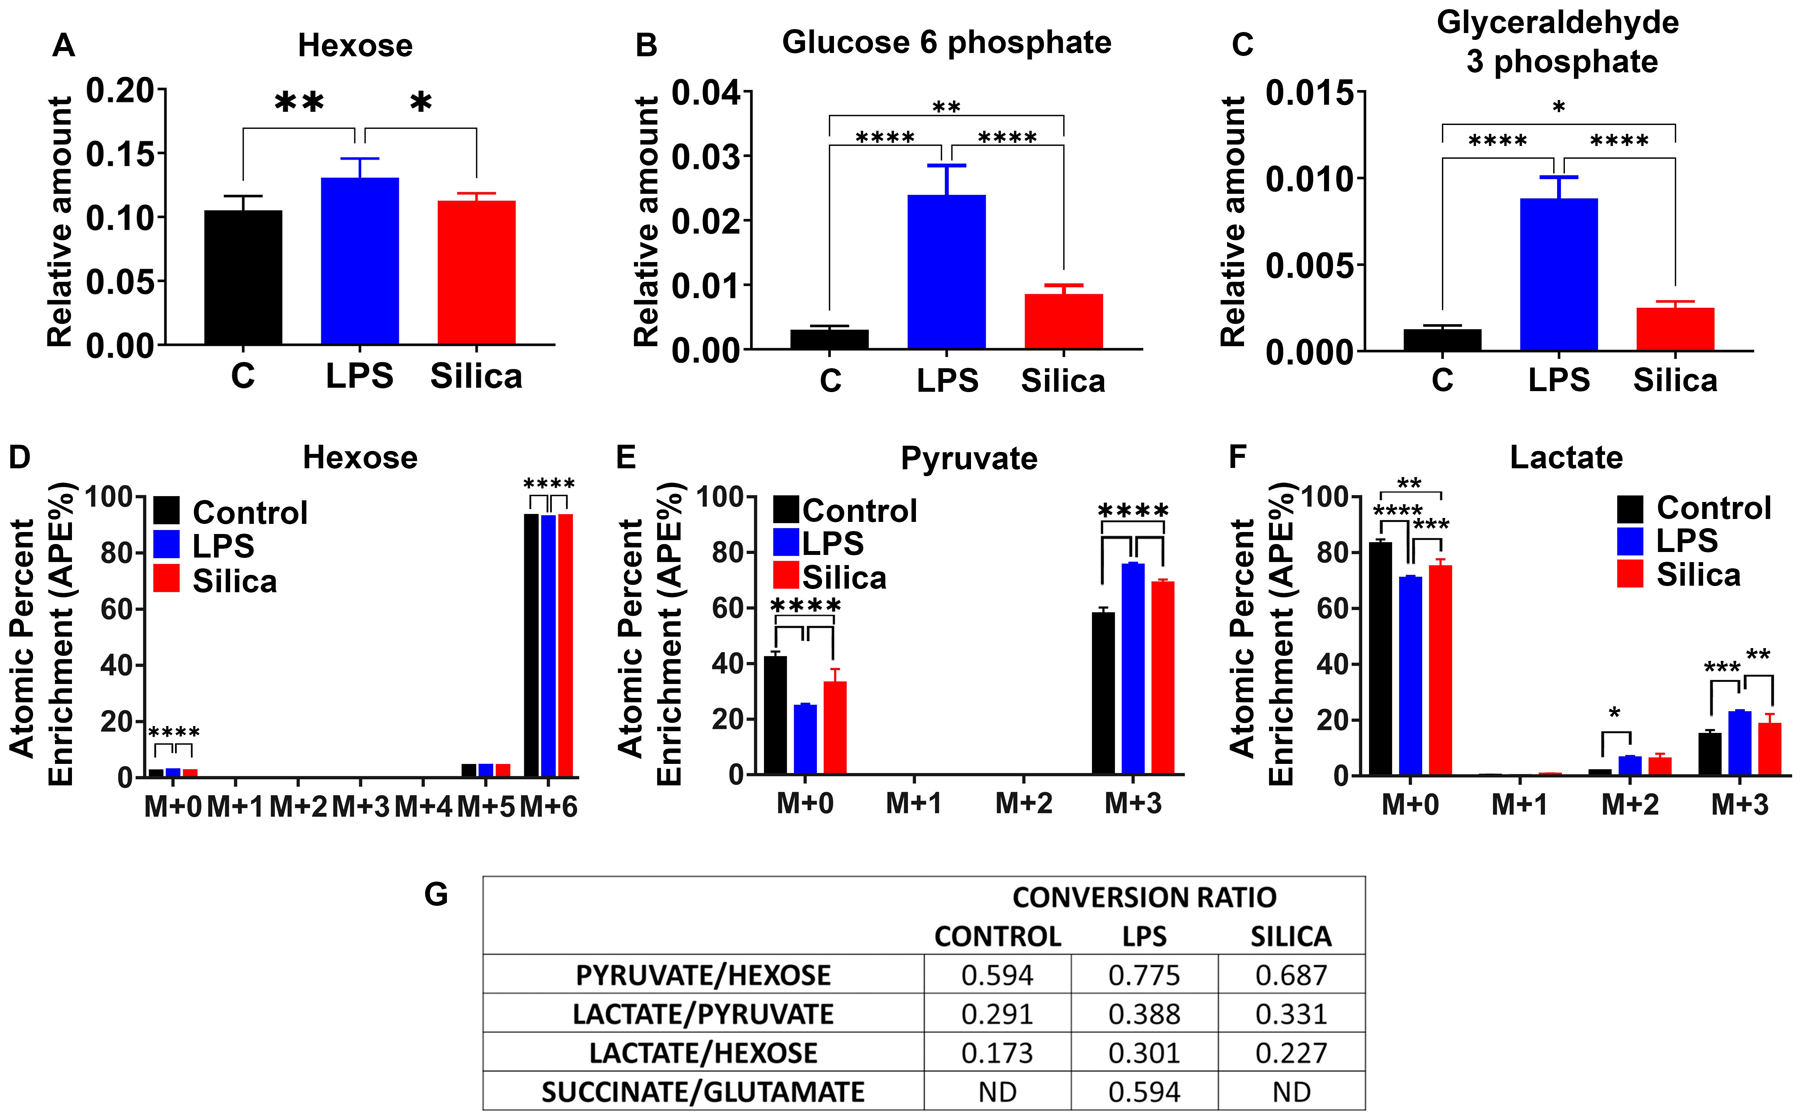
RAW 264.7 macrophages were treated with LPS (10 ng/ml) or Silica (50 μg/cm2) or left untreated for 6 h. (A–C) Intracellular relative amount of hexose uptake and glycolytic metabolites glucose-6-phosphate and glyceraldehyde-3-phosphate. (D–F) 13C6 uptake and intracellular pyruvate and lactate enrichment were determined by LC-HRMS. Atomic percent enrichment was calculated using the Mass isotopomer multi-ordinate spectral analysis (MIMOSA) method. Data are the mean ± SEM of 6 samples N=6 * p<0.05, ** p<0.01, *** p<0.001, ****p<0.0001, control vs LPS vs Silica. (G) Table representing the conversion ratio of selected metabolites calculated dividing the total enrichment (sum of absolute number M+1 to M+6) of the product by the total enrichment of the reactant.