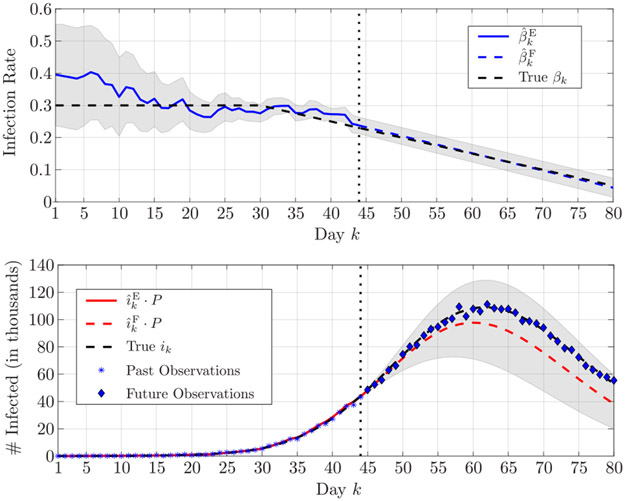
FIGURE 4.
Estimation and forecasting, respectively in solid and dashed lines, of (top) the infection rate and (bottom) the number of infected individuals in the first scenario; the superscripts E and F stand for estimate and forecast, respectively. The estimation is up to k = 44 (marked by a vertical dotted line), and the forecast is up to k = 80. The shaded areas represent the 90% confidence interval.

