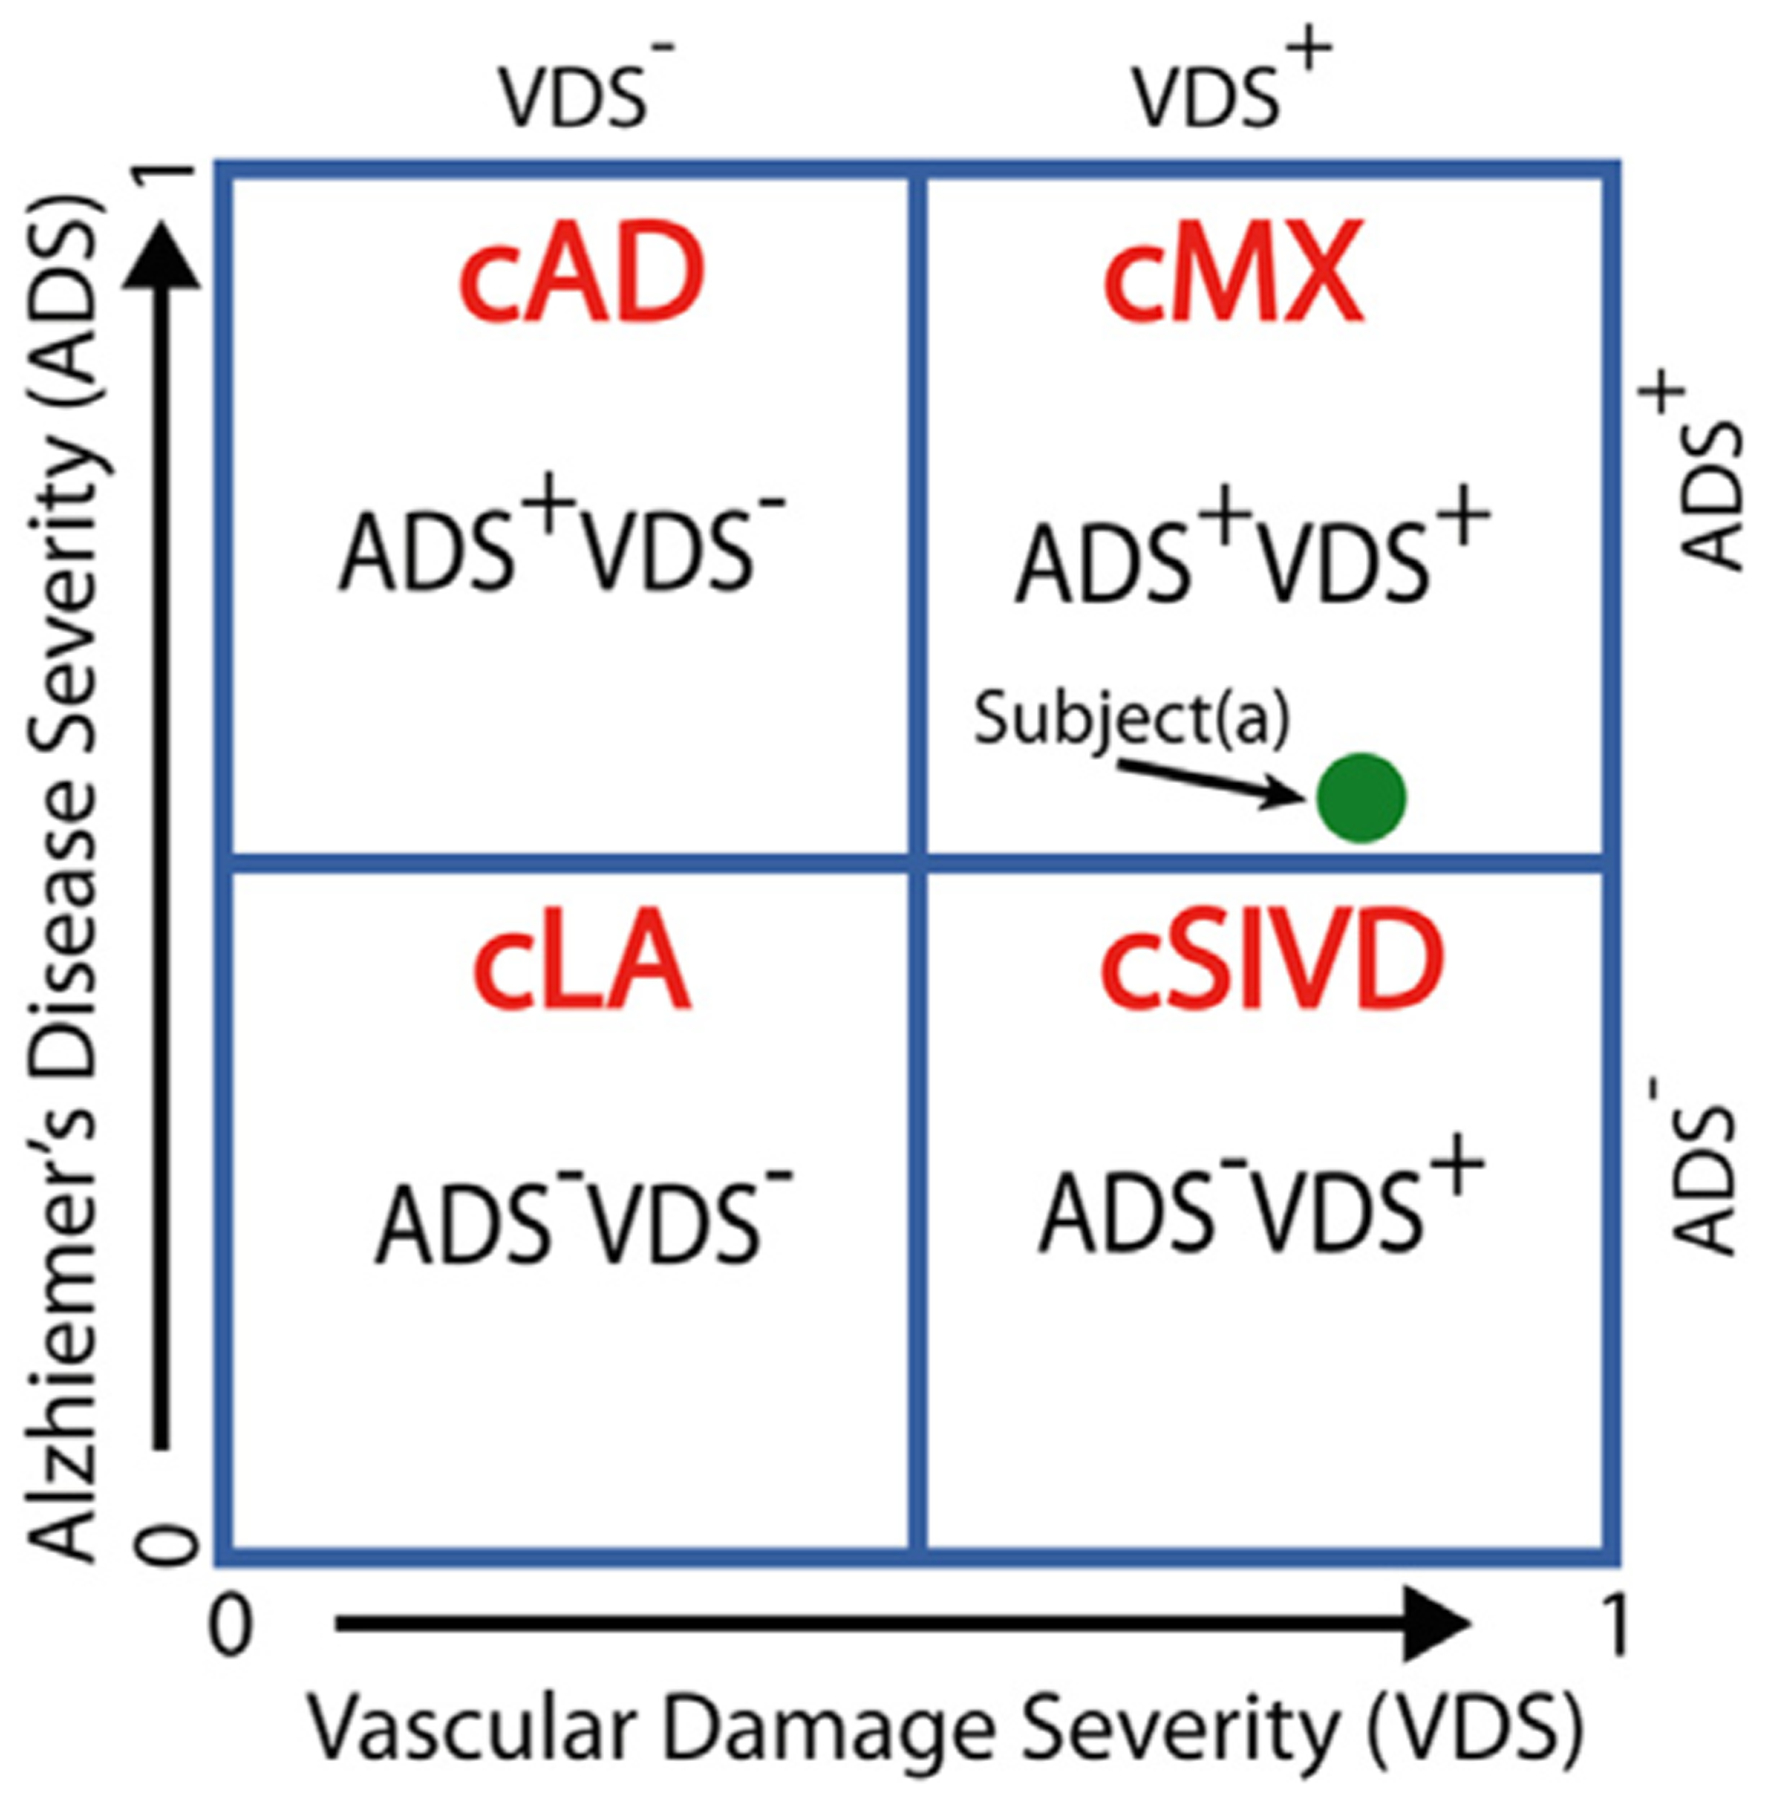
Fig. 3.

The double-dichotomy clustering method is a two-dimensional scatter plot with the x-axis being the VDS score and the y-axis being the ADS score, and a cut-off of 0.5 for each axis gives four quadrants, with each quadrant describing subjects with different disease characteristics. The four cluster (c)-based patient groups are cLA = VDS− ADS−, cAD = VDS− ADS+, cSIVD = VDS+ ADS−, and cMX = VDS+ ADS+. The location of a subject on this plot describes disease severity. For example, subject(a) is classified as cMX, but being close to the ADS boundary, we know that its ADS factors are similar to some of the SIVD subjects.
