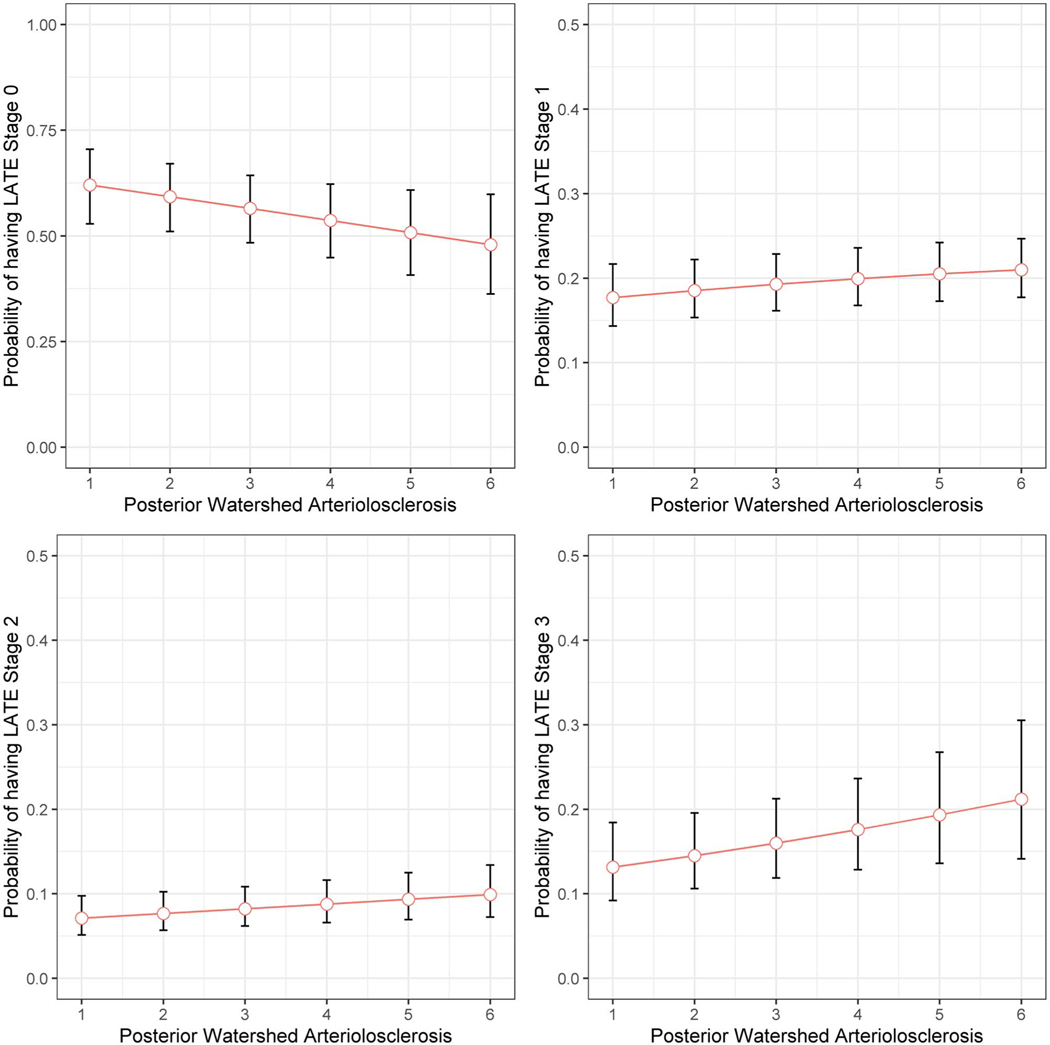
FIGURE 2.
Probability of having LATE-NC stages across the posterior watershed arteriolosclerosis severity. The figure illustrates model predicted probabilities of having LATE-NC for a representative female participant with average age and years of education, as functions of posterior watershed arteriolosclerosis. Red circles indicate model predicted probabilities, and vertical line segments indicate corresponding 95% confidence intervals

