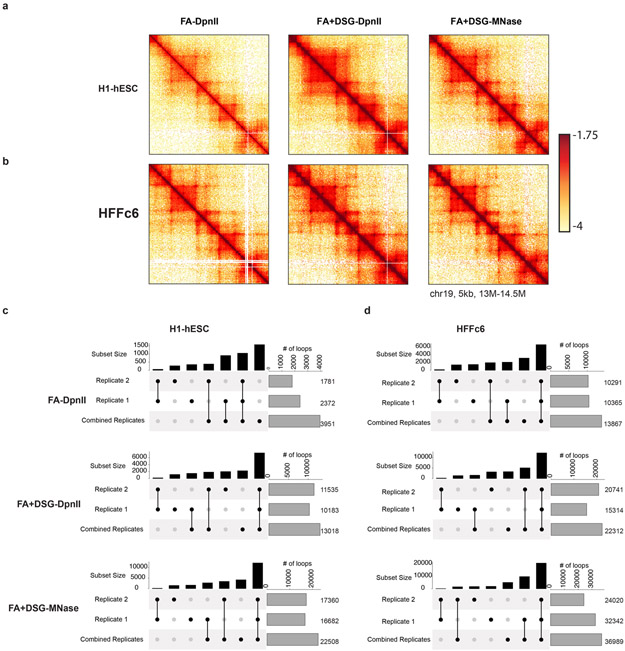
Extended Data Fig. 4. FA+DSG cross-linking produces reproducible chromatin loops.
a. Interaction heatmaps (log transformed) of experiments for H1-ESC cells obtained from the following cross-linker-enzyme combinations (from left to right): FA-DpnII, FA+DSG-DpnII and FA+DSG-MNase.
b. Interaction heatmaps of protocols specified in Extended Data Fig. 4a for HFFc6 cells.
c. Upset plots of loops detected with different replicates for H1-hESC show: 1) total number of loops detected in Replicate 1, Replicate 2 and merged replicates on the right side (gray bars), 2) number of loops detected in the one, two or three experiments shown in black bars. Loops found with only one or multiple experiments are highlighted and connected with black dots. Here Upset plots investigate the consistency of loops between each of the replicates and combined replicates for FA-DpnII, FA+DSG-DpnII and FA+DSG-MNase in H1-hESC.
d. Upset plots (as explained in Extended Data Fig. 4c) of loops detected with different replicates for HFFc6 cells.

