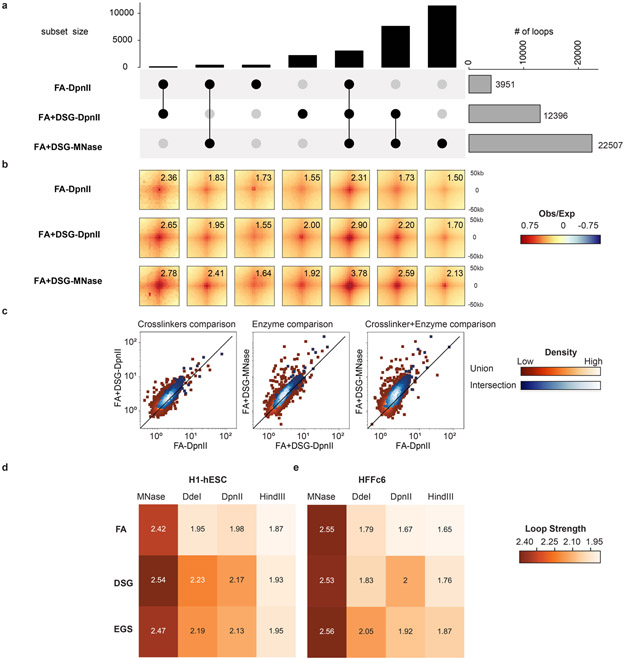
Extended Data Fig. 5. Fine fragmentation and DSG cross-linking improves loop detection.
a. Loops for HFFc6 shows the 1) total number of loops detected with FA-DpnII, FA+DSG-DpnII and FA+DSG-MNase(gray bars, right side), 2) number of overlapping loops detected (black bars). Overlapping loops are connected with black dots.
b. Pileups of the loops from Figure 4a. Numbers represent signal enrichment over local background (Methods).
c. Individual loop strength (as in panel b) between protocol pairs in HFFc6. Protocols (left to right): FA-DpnII v/s FA+DSG-DpnII, FA+DSG-DpnII v/s FA+DSG-MNase and FA-DpnII v/s FA+DSG-MNase. Plots display two sets of looping interactions - Union (red squares) and Intersection (blue circles) from the three protocols. Color scale represents density of loop interactions.
d,e. Aggregated loop strengths of intersection loop set from matrix of 12 protocols (described in Fig 1a) for H1-hESC (d), and HFFc6 (e).

