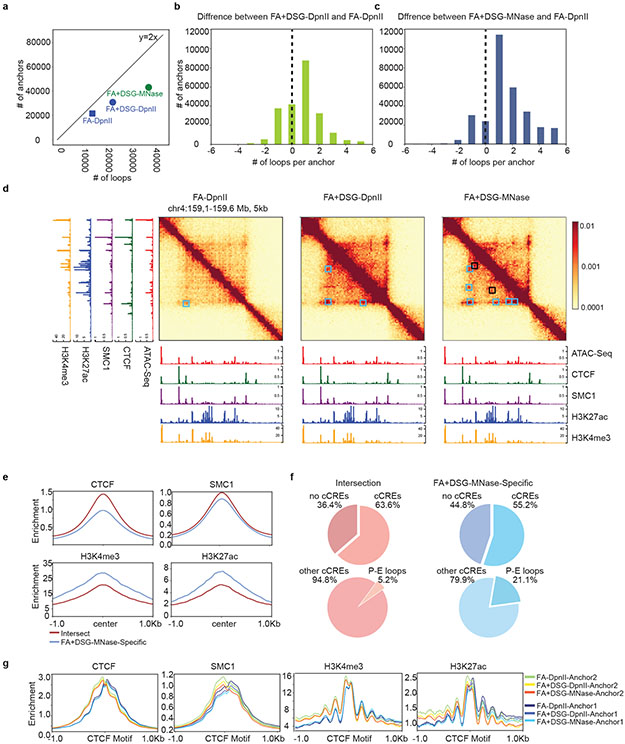
Figure 5: Characterization of interactions and chromatin features of loop anchors.
a. Number of loops versus number of loop anchors in HFFc6. Expected relationship between anchor engaged in one loop: y=2x
b,c.FA-DpnII loops subtracted from FA+DSG-DpnII (b) or FA+DSG-MNase (c) loops detected at the same anchors. Union loops of the plotted protocols were used.
d. Interactions (linear scale) and Cut&Run/Cut&Tag signals for CTCF, SMC1, H3K4me3 and H3K27ac Loop anchors detected with all three protocols (Cyan squares) or only with FA+DSG-MNase (Black squares) (37).
e. CTCF, SMC1, H3K4me3 and H3K27ac enrichments at loop anchors detected by all protocols (intersection) or FA+DSG-MNase alone in HFFc6. Open chromatin regions within anchor coordinates were used to center average enrichments.
f. cCREs detected in common and FA+DSG-MNase specific loop anchors from Figure 5e (top) and stratified percentage of Promoter-Enhancer cCREs without CTCF enrichment (bottom).
g. Enrichment of CTCF, SMC1, H3K4me3 and H3K27ac separated between left (Anchor1) and right (Anchor 2) anchor for anchors detected in HFFc6 using FA-DpnII, FA+DSG-DpnII or FA+DSG-MNase.

