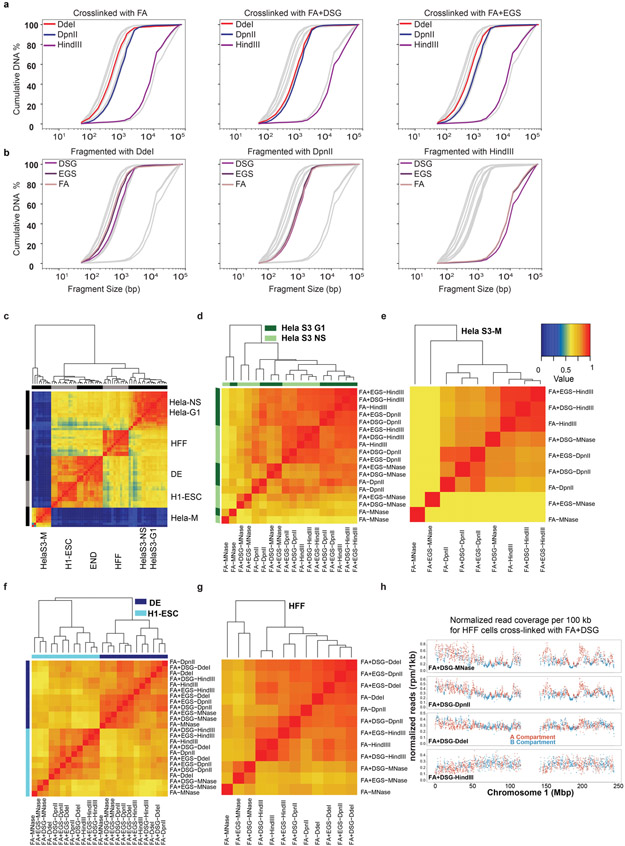
Extended Data Fig. 1. DNA fragmentation and clustering of correlation (HiCRep).
a,b. Cumulative distribution of the lengths of fragmented DNA obtained from fragment analyzer data in HFF cells stratified for different cross-linkers (a) and restriction enzymes (b). Gray lines indicate all datasets, colored lines indicate data obtained with the indicated nuclease/cross-linkers.
c-g. Hierarchical clustering of HiCRep correlations for: all protocols comparing cell states (c), synchronized HeLa-S3 G1 cells (dark green) and non-synchronized HeLa-S3 cells (light green) (d), synchronized HeLa-S3 mitotic cells (e), H1-hESC and H1-hESC derived DE cells (f), 12 protocols applied to HFF cells (g). One color key is indicated for all of the heatmaps.
h. Genome coverage of data generated using MNase, DdeI, DpnII and HindIII. The read density was normalized to reads per million, separated by the coverage in A and B compartments (Methods).

