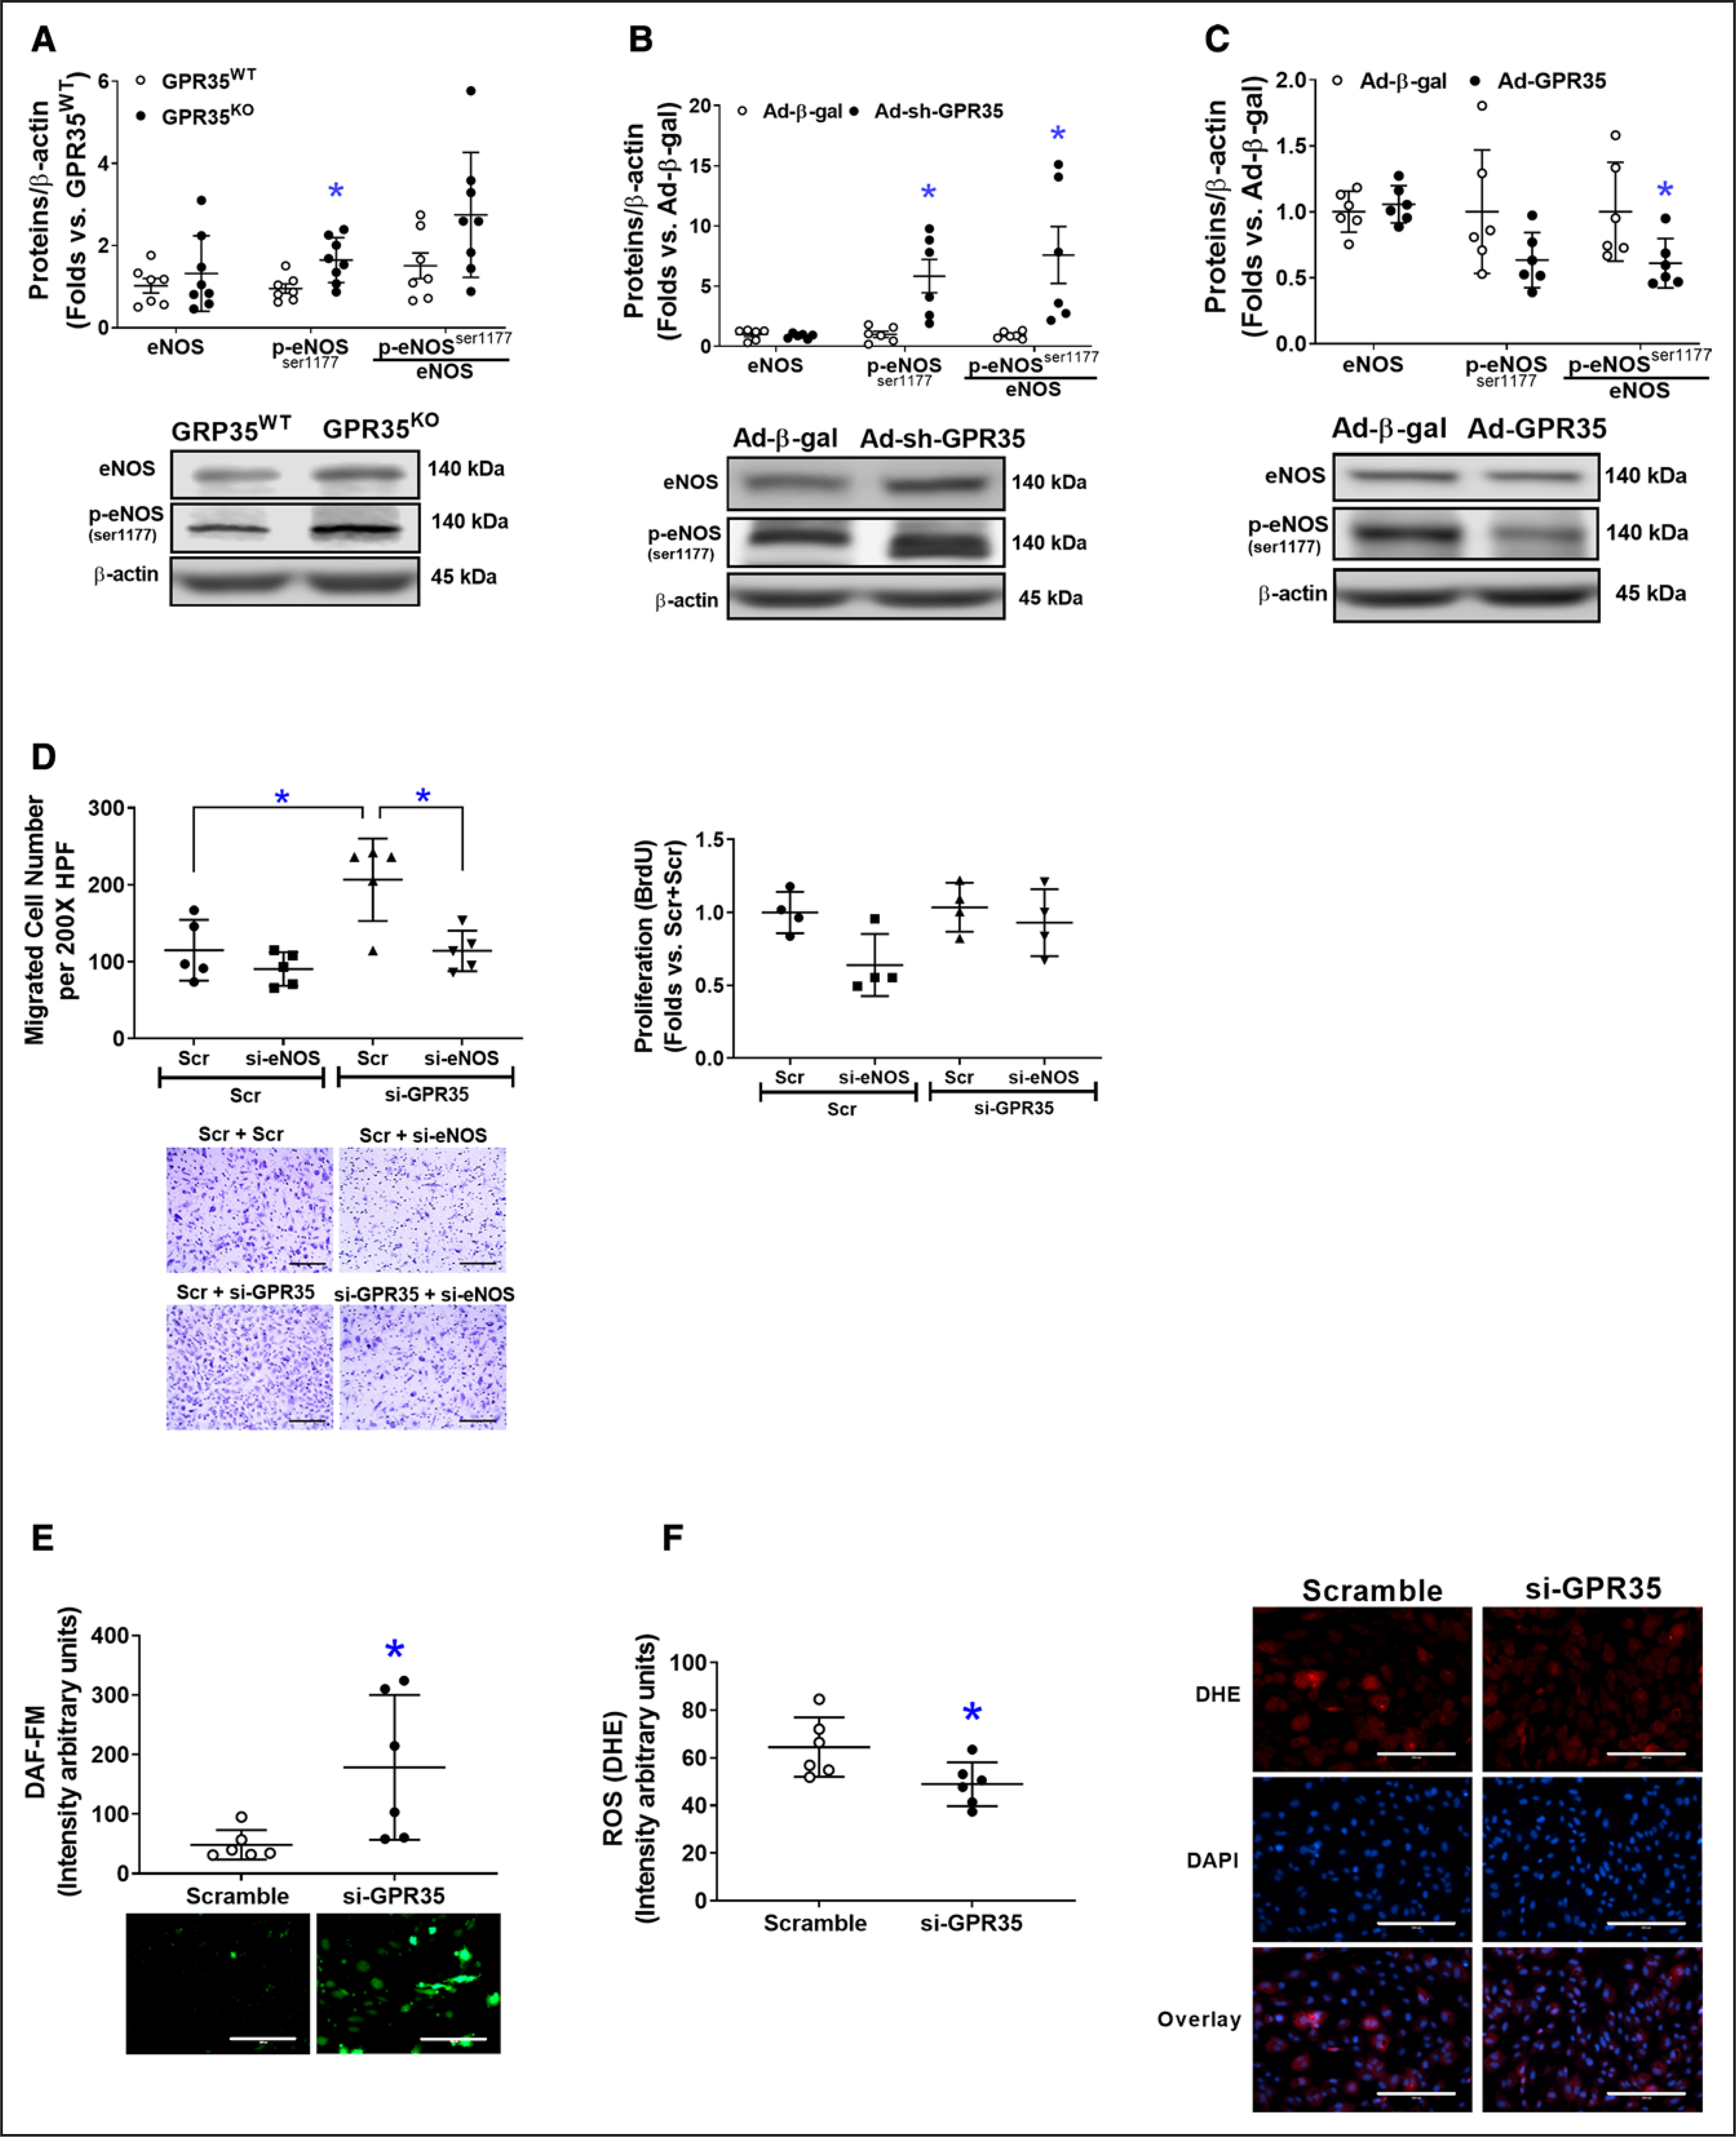
Figure 3. Deletion of GPR35 (G-protein–coupled receptor 35) increased eNOS (endothelial nitric oxide synthase) activation in human aortic endothelial cells (HAECs).

The protein levels of total eNOS (noted as eNOS), phosphorylated eNOS at Ser1177(p-eNOSser1177), and β-actin were determined by Western blot analysis using β-actin as a housekeeping protein. The extent of eNOS phosphorylation was calculated as the ratio of p-eNOS (Ser1177) to total eNOS (p-eNOSser1177/eNOS). Representative images are shown beneath the quantifications. A, The eNOS, p-eNOSser1177, and p-eNOSser1177/eNOS in GPR35WT and GPR35KO mouse aortic ECs (MAECs). n=7 in GPR35WT, n=8 in GPR35KO ECs. Mann-Whitney U tests were used. *P<0.05 vs GPR35WT. B, The eNOS, p-eNOSser1177, and p-eNOSser1177/eNOS in HAECs infected with Ad-sh-GPR35 or Ad-β-gal. n=6 per group. Mann-Whitney U tests were used. *P<0.05 vs Ad-Ad-β-gal. C, The eNOS, p-eNOSser1177, and p-eNOSser1177/eNOS in HAECs infected with Ad-sh-GPR35 or Ad-β-gal. n=6 per group. Mann-Whitney U tests were used. *P<0.05 vs Ad-Ad-β-gal. D, Functional assays including migration (left) and proliferation (right) in HAECs transfected with siRNA against eNOS (si-eNOS) and siRNA against GPR35 (si-GPR35), using scramble oligo as control. Representative images are shown next to the quantifications. Scale bar, 200 μm. n=5 per group in the migration assay, n=4 per group in the proliferation assay. Kruskal-Wallis tests were done, followed by Mann-Whitney U tests with Hommel’s adjustment. *P<0.05 between the 2 groups in post hoc comparisons. E, Quantification of fluorescent staining of NO production in HAECs transfected with siRNA against GPR35 (si-GPR35), using scramble oligo as control. Representative images are shown. Scale bar, 200 μm. n=6 per group. Mann-Whitney U tests were used. *P<0.05 vs Scramble. F, Quantification of fluorescent staining of reactive oxygen species (ROS) in HAECs transfected with si-GPR35, using scramble oligo as control. Representative images are shown. Scale bar, 200 μm. n=6 per group. Mann-Whitney U tests were used. *P<0.05 vs Scramble. In all the figures, horizontal lines show mean±SD.
