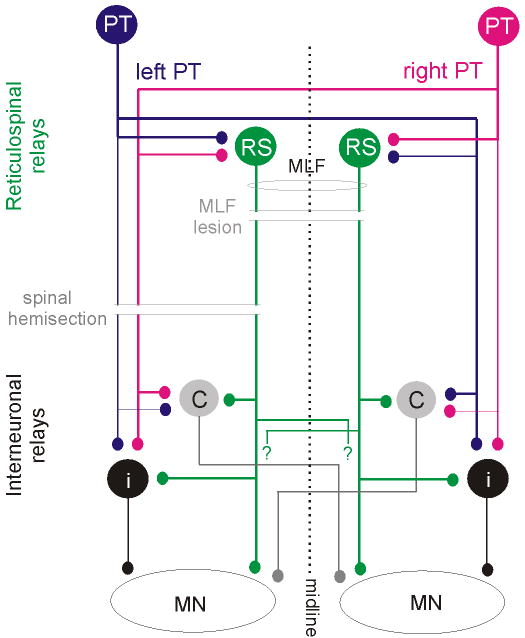
Figure 2. Diagram of hypothesized neuronal pathways from PT and RS neurons to back motoneurons and of two experimental approaches used to verify them.
Blue and red circles and lines represent left and right side pyramidal tract (PT) neurons and their projections. Green circles represent reticulospinal (RS) neurons with axons descending within the medial longitudinal fasciculus (MLF); crossed segmental axon collaterals with unspecified target cells are indicated with “?”. Grey and black circles represent spinal target neurons of the PT and RS neurons, black projecting ipsilaterally and grey contralaterally. Thinner lines denoting ipsilaterally descending PT fibers and axons of interneurons indicate weaker projections. Parallel horizontal lines indicate lesions of the MLF (made to test the relative contribution of RS neurons) and the spinal cord hemisection (made to test the relative contribution of all descending tract and propriospinal tract neurons on the left side as well as the relative contribution of ipsilaterally and contralaterally projecting spinal interneurons).

