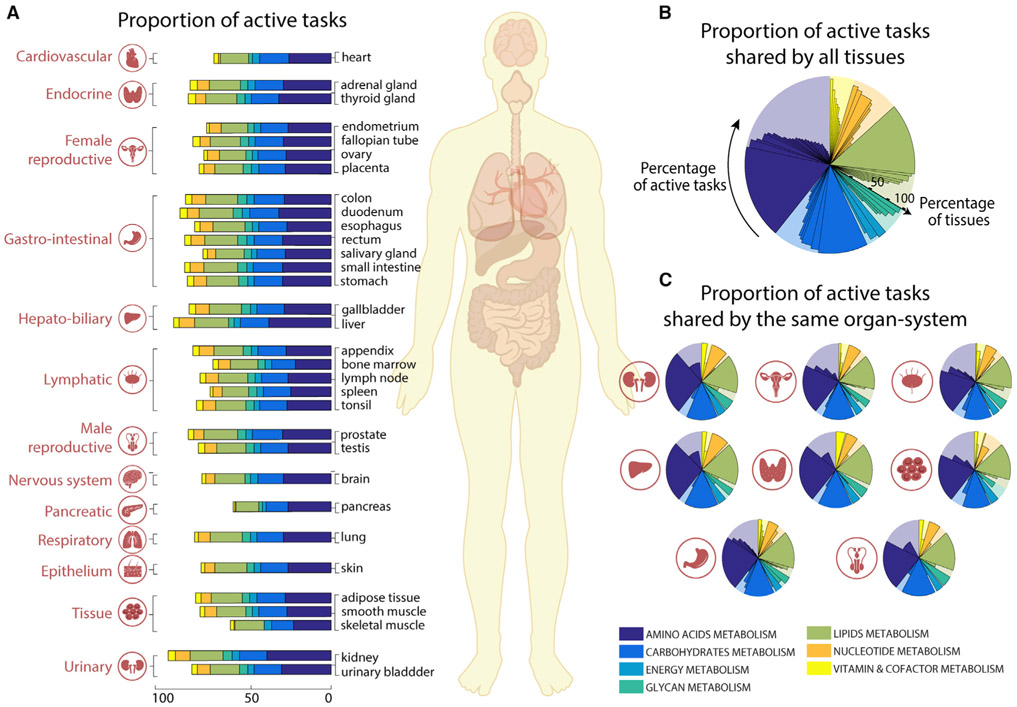
Figure 2. Metabolic tasks capture functional similarities between human tissues.
(A) The proportion of tasks identified as active in the seven major metabolic activities for each of the 32 tissues present in the Human Protein Atlas (Uhlén et al., 2015).
(B and C) Shown are (B) the percentage of active tasks that are shared by all tissues and (C) those shared within the same organ systems (Table S3). The background shaded color distribution represents the assignment of the 195 curated tasks to seven main metabolic systems.

