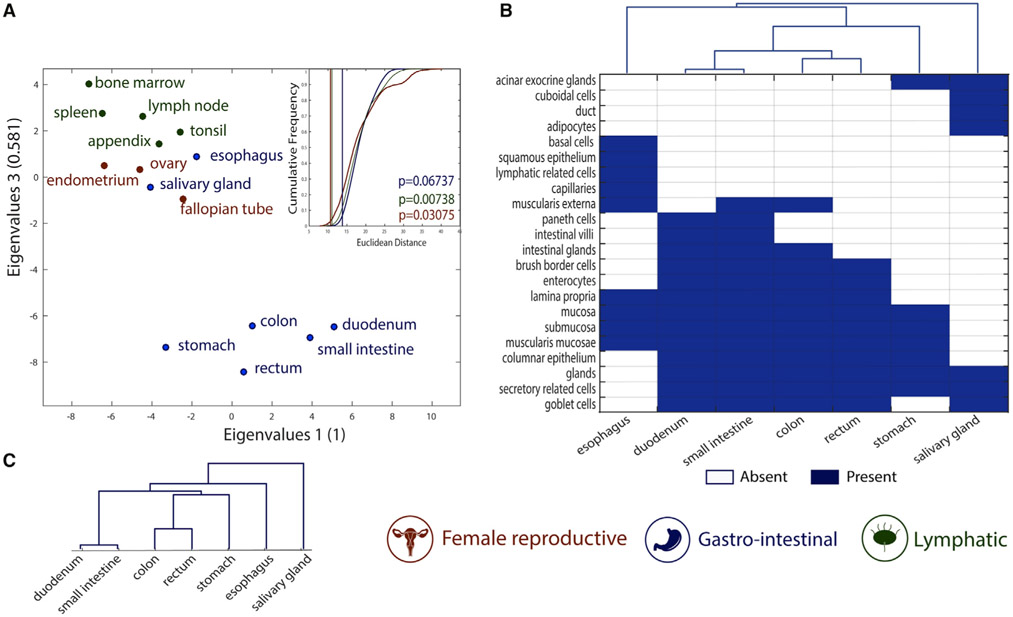
Figure 3. Metabolic tasks capture the histological similarities of tissues.
(A) Visual representation of the similarity between tissues computed on the basis of the metabolic task approach using a principal coordinates analysis. The mean Euclidean distance for 100,000 randomly selected groups with the same number of tissues (inset) highlights the significance of the tissues clustering into organ systems. The vertical lines are the mean Euclidean distance between tissues belonging to the same organ system and their empirical p value (see STAR Methods for more details).
(B) Heatmap and hierarchical clustering of histological similarities between tissues of the gastrointestinal group.
(C) Hierarchical clustering of similarities between tissues of the gastrointestinal group computed on the basis of the metabolic task approach.

