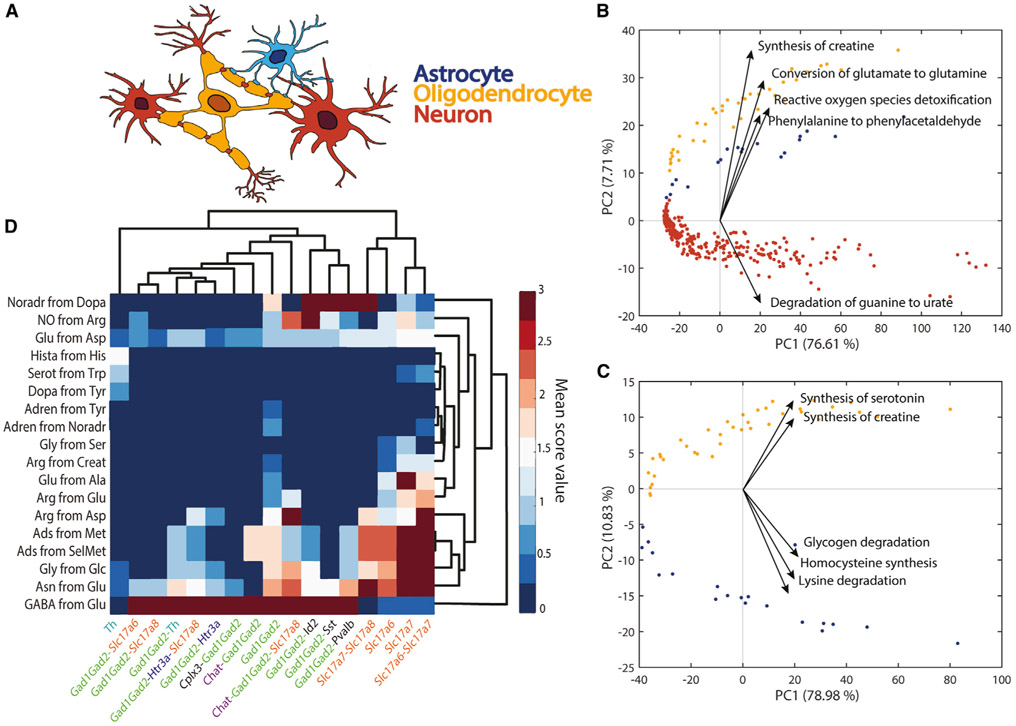
Figure 5. Metabolic differences between astrocytes, neurons, and oligodendrocytes.
(A) Schematic representation of spatial connection between astrocytes (blue), neurons (red), and oligodendrocytes (yellow).
(B) Principal component analysis (PCA) component scores for the three different cell types (astrocytes, blue; neurons, red; oligodendrocytes, yellow) and the five dominant tasks in the second principal component. The five tasks most influencing the third principal component are presented in Figure S2A.
(C) PCA component scores for only two cell types (astrocytes, blue; oligodendrocytes, yellow) and the five dominant tasks in the second principal component. The five tasks most influencing the third principal component are presented in Figure S2B.
(D) Heatmap of metabolic tasks score mean values associated with the synthesis of main neurotransmitters in the context of the gene markers for different neuron types (i.e., mean of the metabolic task score obtained for all samples associated with specific set of gene markers). The known gene markers are highlighted with different colors (e.g., GAD family in green, Slc17 gene family in orange, Chat gene marker in purple).

