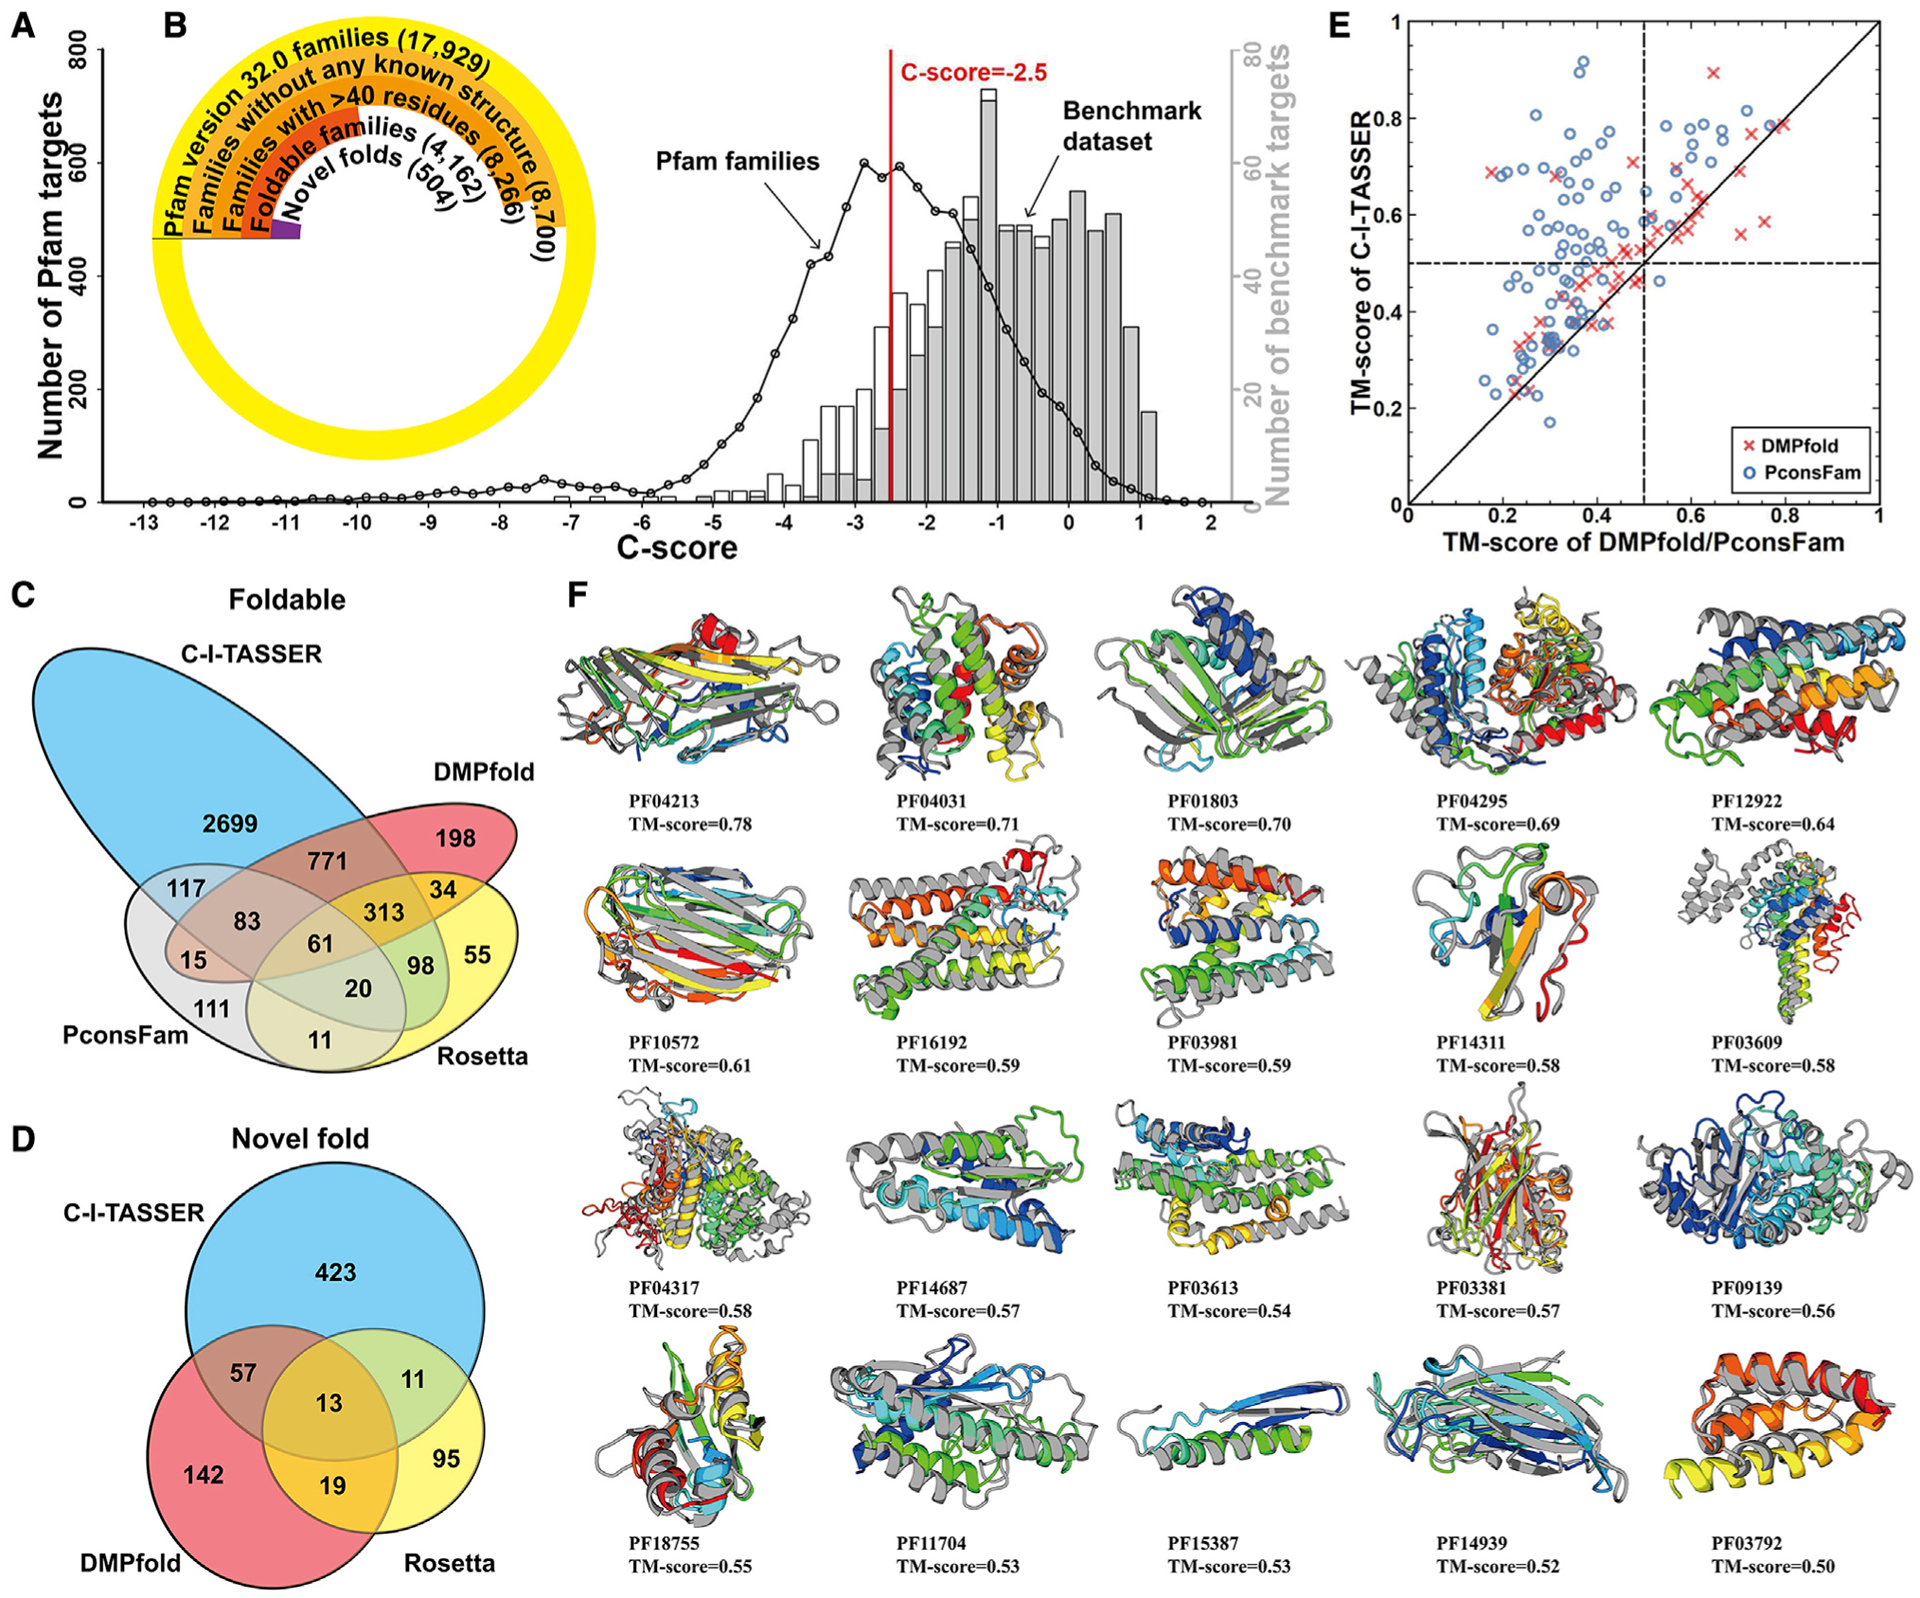
Figure 4. Structural modeling results for unsolved Pfam families.

(A) The distribution of Pfam families and benchmark targets in different C-score bins. The black circles represent the number of Pfam targets in a specific C-score bin, and histograms are from benchmark proteins; the gray bars indicate the number of foldable targets with TM ≥ 0.5 and the white bars being the number of non-foldable targets.
(B) Number of Pfam families at each stage of the analysis, where each set is a subset of the previous set.
(C) Venn diagram for the number of foldable models for the Pfam families constructed by C-I-TASSER, Rosetta, DMPfold, and PconsFam.
(D) Venn diagram for the number of novel folds for the Pfam families produced by C-I-TASSER, Rosetta, and DMPfold.
(E) Comparison of the TM scores for the first models produced by C-I-TASSER versus those by DMPfold (red crosses) and PconsFam (blue circles) for 96 Pfam families that have at least one member newly solved after modeling.
(F) Case study of 20 Pfam families regarded as hard by LOMETS. In each case, the model is shown in rainbow color and the solved experimental structure of a member from the same Pfam family, if available, is shown in gray.
