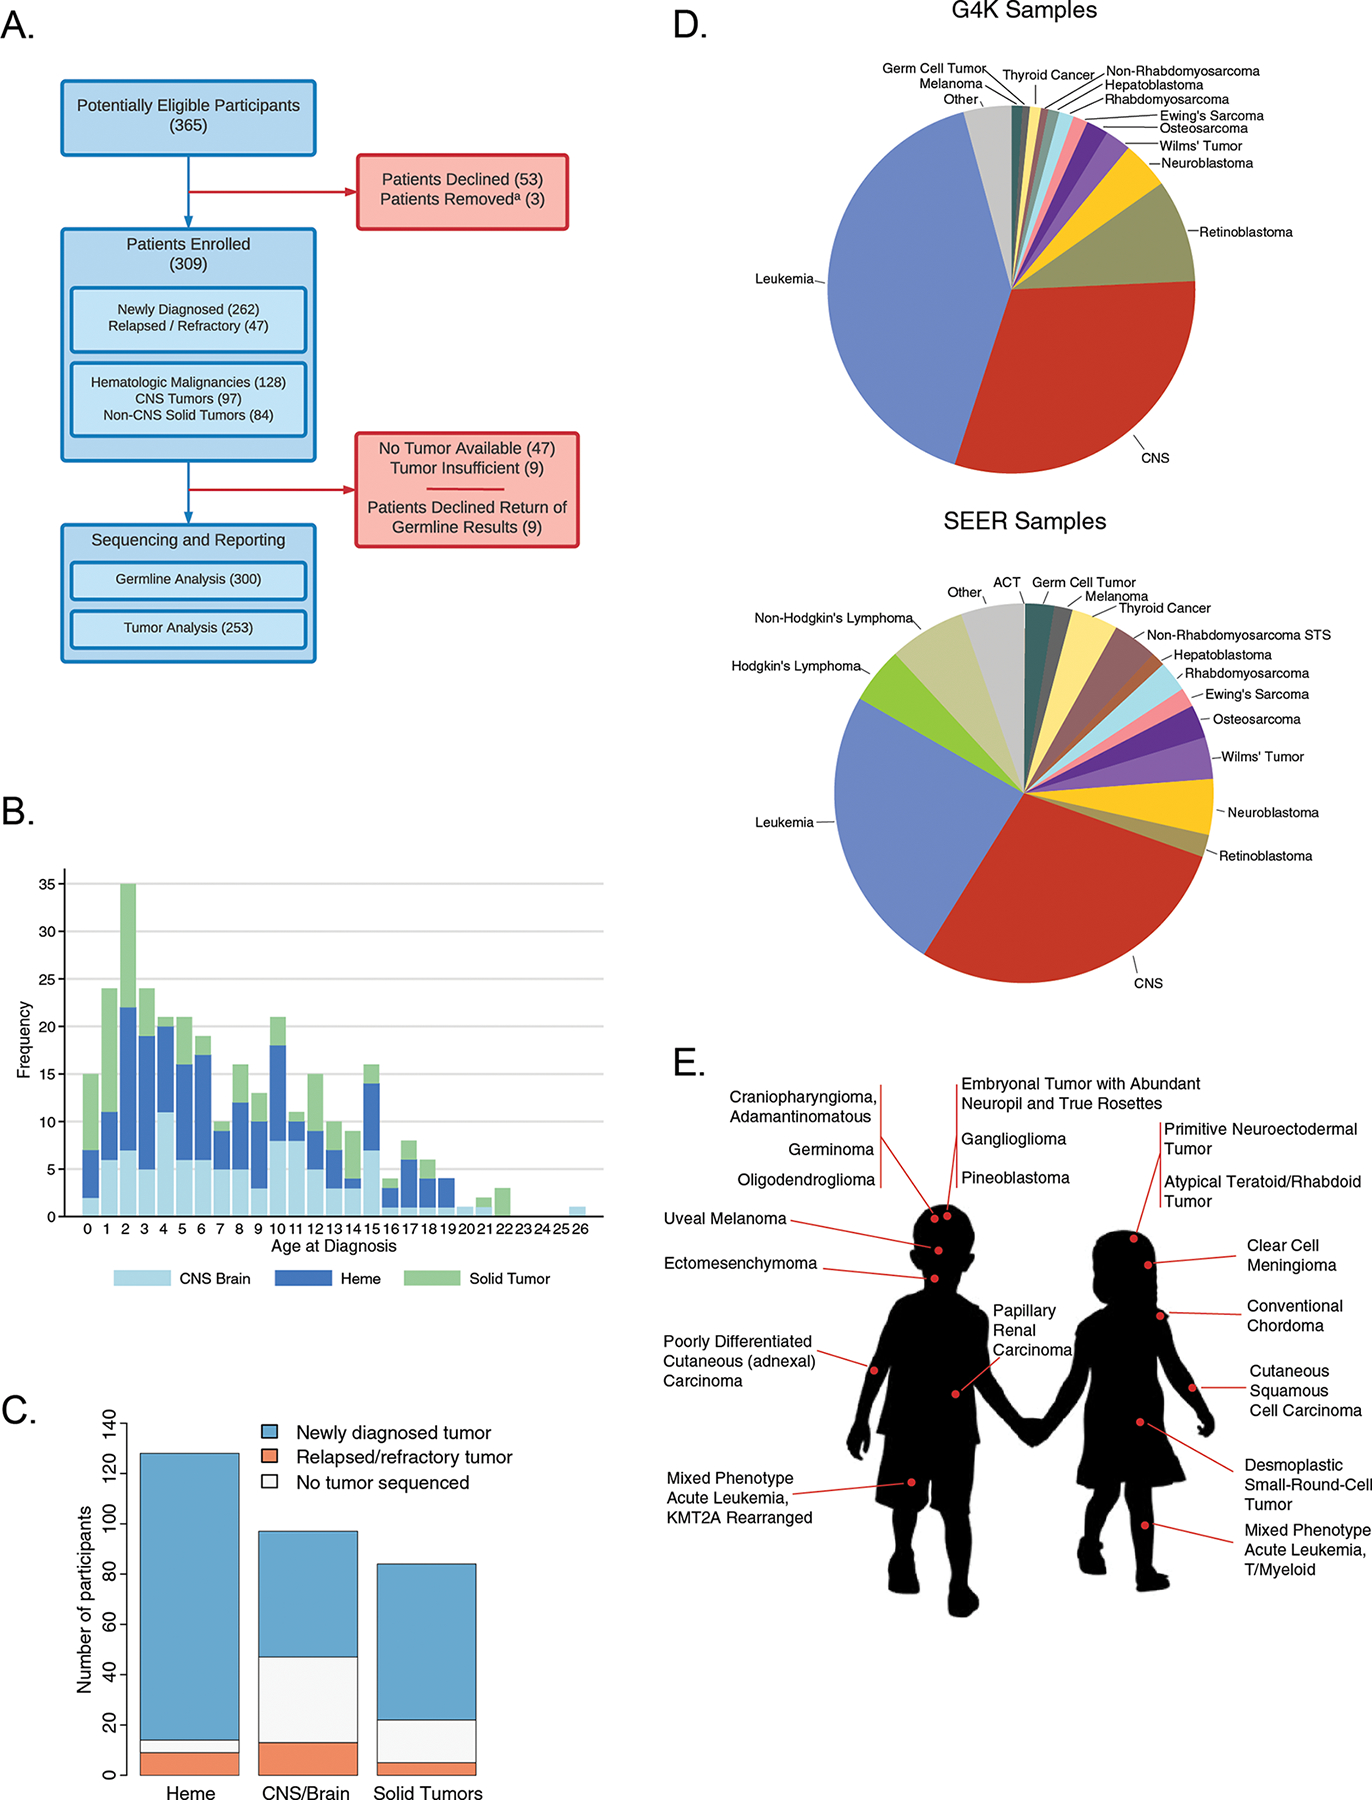
Figure 1. Patient accrual and demographic data.

A. Consort diagram depicting patient accrual into G4K. Note: (a) Three patients were removed from the study when pathology revealed no cancer (1); the patient died before a germline sample could be collected (1); or the patient declined return of germline results and there was insufficient tumor for sequencing (1). B. Age distribution of patients. C. Number of patients with newly diagnosed, relapsed or refractory tumors, or no tumor available for sequencing, broken down by major tumor type. D. The distribution of cancer types represented in the G4K cohort (top) compared to the distribution of pediatric cancers in the NCI Surveillance, Epidemiology and End Results (SEER) program (bottom). E. Eighteen rare tumor types found in the G4K cohort present at less than 2 per million children annually in the United States
