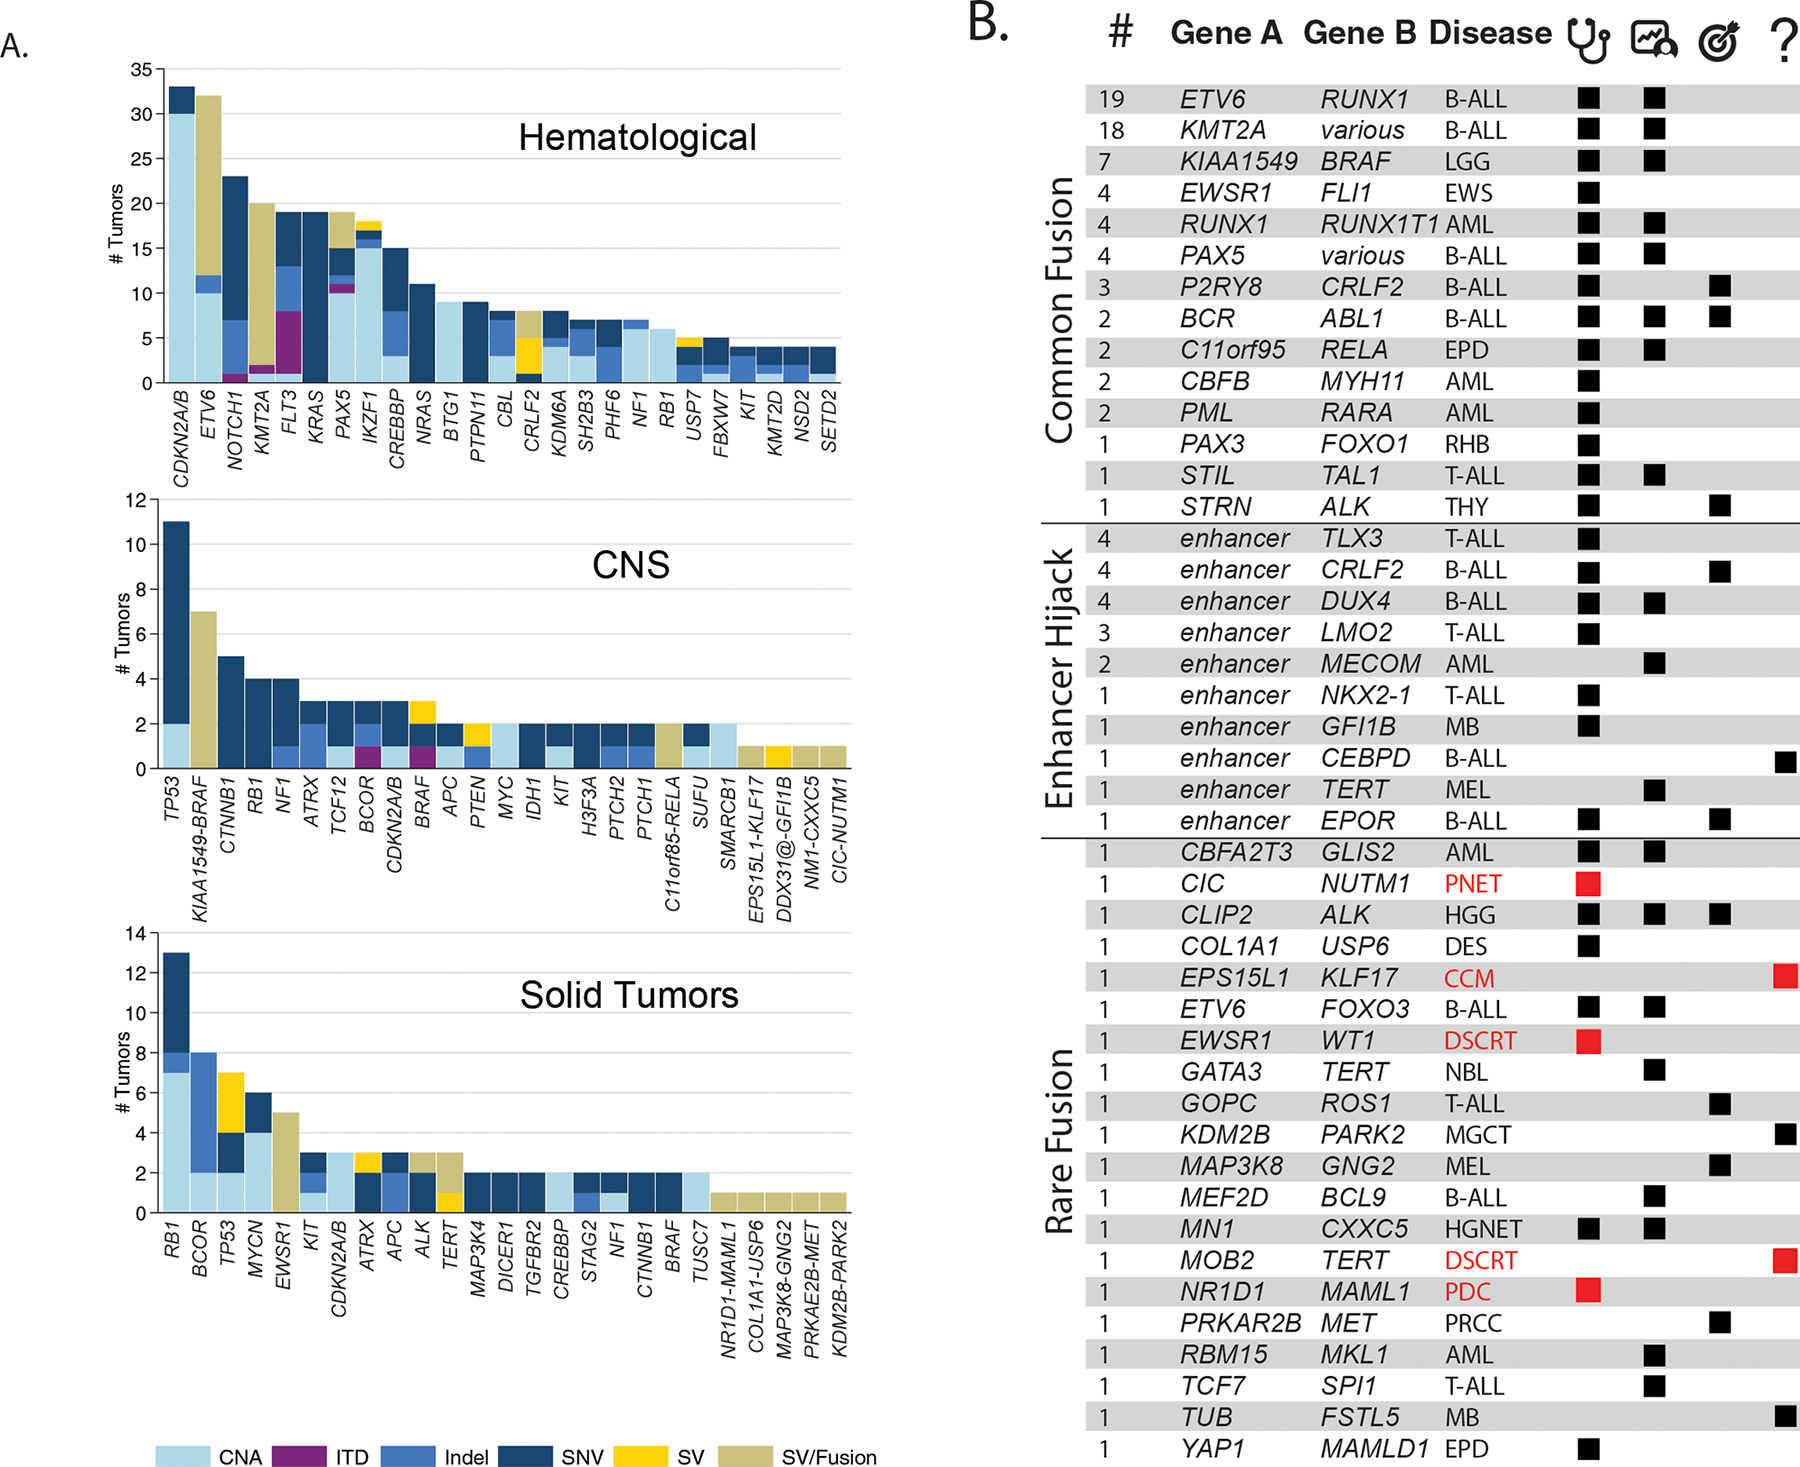
Figure 2. Somatic findings in the 253 analyzed tumors.

A. Bar charts showing the numbers and relative contributions of mutational mechanisms affecting cancer genes in the tumors analyzed through G4K. The top 25 mutated genes for hematologic, CNS and solid tumors are shown as are gene fusions or enhancer hijack events for singletons in CNS and Solid Tumors. B. Gene fusions and enhancer hijacks detected in G4K samples. Number of samples with a given fusion are indicated in the left most column followed by the genes/loci involved and the diseases in which they were detected (see Supplemental Fig. S3 for schematics depicting the 20 rare fusions). Black or red tiles indicate whether the identified gene fusions or enhancer hijacks have a clear or likely clinical utility, arranged into three columns indicating diagnostic (stethoscope), prognostic (patient chart), and therapeutically-relevant (target) categories. In the right most column (question mark), tiles indicate lesions with an unknown clinical utility, but considered biologically relevant to the tumor. Red disease names and tiles were identified in the rare tumors as shown in Fig. 1E. Disease abbreviations and additional details regarding SV classifications and literature citations can be found in Supplemental Table 2.
