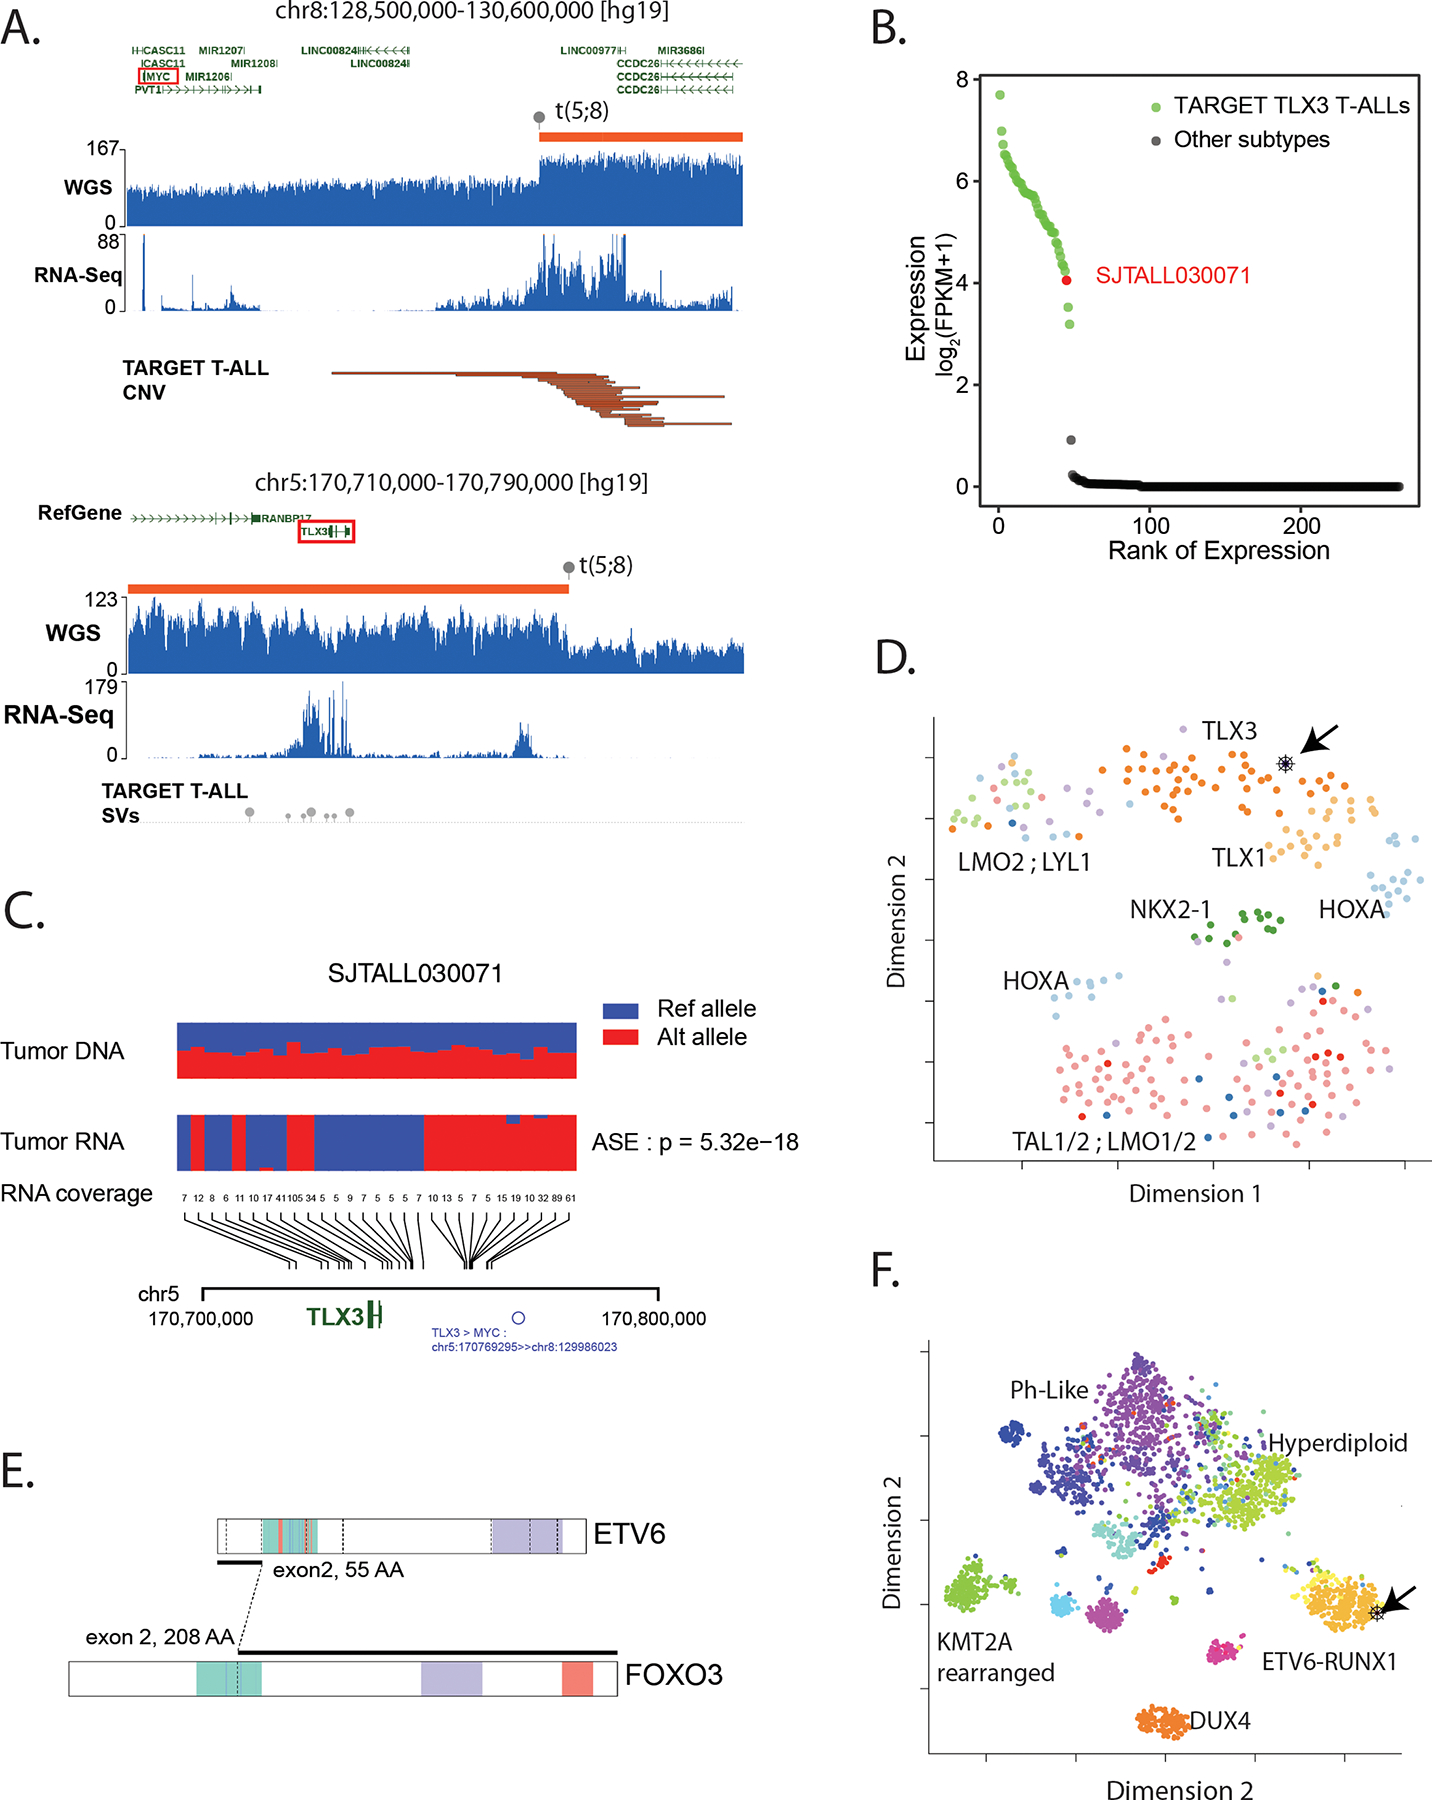
Figure 3. Using multi-omics data to interpret pathogenicity of structural variants.

A. GenomePaint plots showing two regions, chr8:128500000–130600000 (top) and chr5: 170710000–170790000 (bottom) [hg19] from SJTALL030071. Both panels consist of the RefSeq gene model in green with MYC and TLX3 highlighted by red boxes; orange bars show regions of copy number gain supported by increased whole genome sequencing coverage plotted as the blue histogram immediately below. Grey lollypops marked t(5;8) indicate the position of the translocation breakpoint. RNA-Seq coverage is shown below the whole genome coverage histogram. Additional data from TARGET is also shown with narrow red bars representing regions of copy number gain and grey lollypops representing structural variant breakpoints surrounding the TLX3 locus. A region or recurrent copy number gain in TARGET samples is adjacent to the chromosome 8 breakpoint in SJTALL030071. Generally high but non-specific RNA-Seq coverage at this locus suggests a region of high transcriptional activity (distal MYC enhancer) is brought into proximity of TLX3 by the translocation. B. A rank-order plot of TALL from TARGET showing expression levels of TLX3 mRNA in a set of TLX3-activated tumors compared to tumors in which TLX3 was not activated. SJTALL030071 TLX3 expression (red dot) groups with the activated set. C. Allele-specific expression of the TLX3 locus in SJTALL030071. The tumor DNA (top row) shows a series of heterozygous alleles in the TLX3 locus (blue and red stacked bars show relative variant allele fraction from WGS data). In the RNA-Seq data (second row) expression of only one allele is observed. RNA coverage, read counts at each allele, are shown numerically (third row). Beneath the read counts, black lines map the locations of the alleles to the chromosome 5 coordinates surrounding TLX3 locus. Beneath the coordinate line, the location of the SJTALL030071 translocation breakpoint is indicated. D. Two-dimensional t-SNE plot of RNA-Seq-derived gene expression data from 264 T-ALL samples(41). Major T-ALL subgroups are indicated on the plot with SJTALL030071 localizing among the TLX3 cluster, as shown by the black arrow. E. Schematic representation of an ETV6-FOXO3 fusion found in SJBALL030052 joining the region N-terminal to the ETV6 sterile alpha motif domain (green) with oligomerization interfaces (red) and ETS domain (purple), with the C-terminal FOXO3 forkhead binding (green), KIX-binding (purple) and transactivation domains (red). F. Two-dimensional t-SNE plot of RNA-Seq-derived gene expression data from 1,988 B-ALL samples(42). Major subgroups are indicated on the plot with SJBALL030052 localizing to the periphery of the ETV6-RUNX1 subgroup, as shown by the black arrow.
