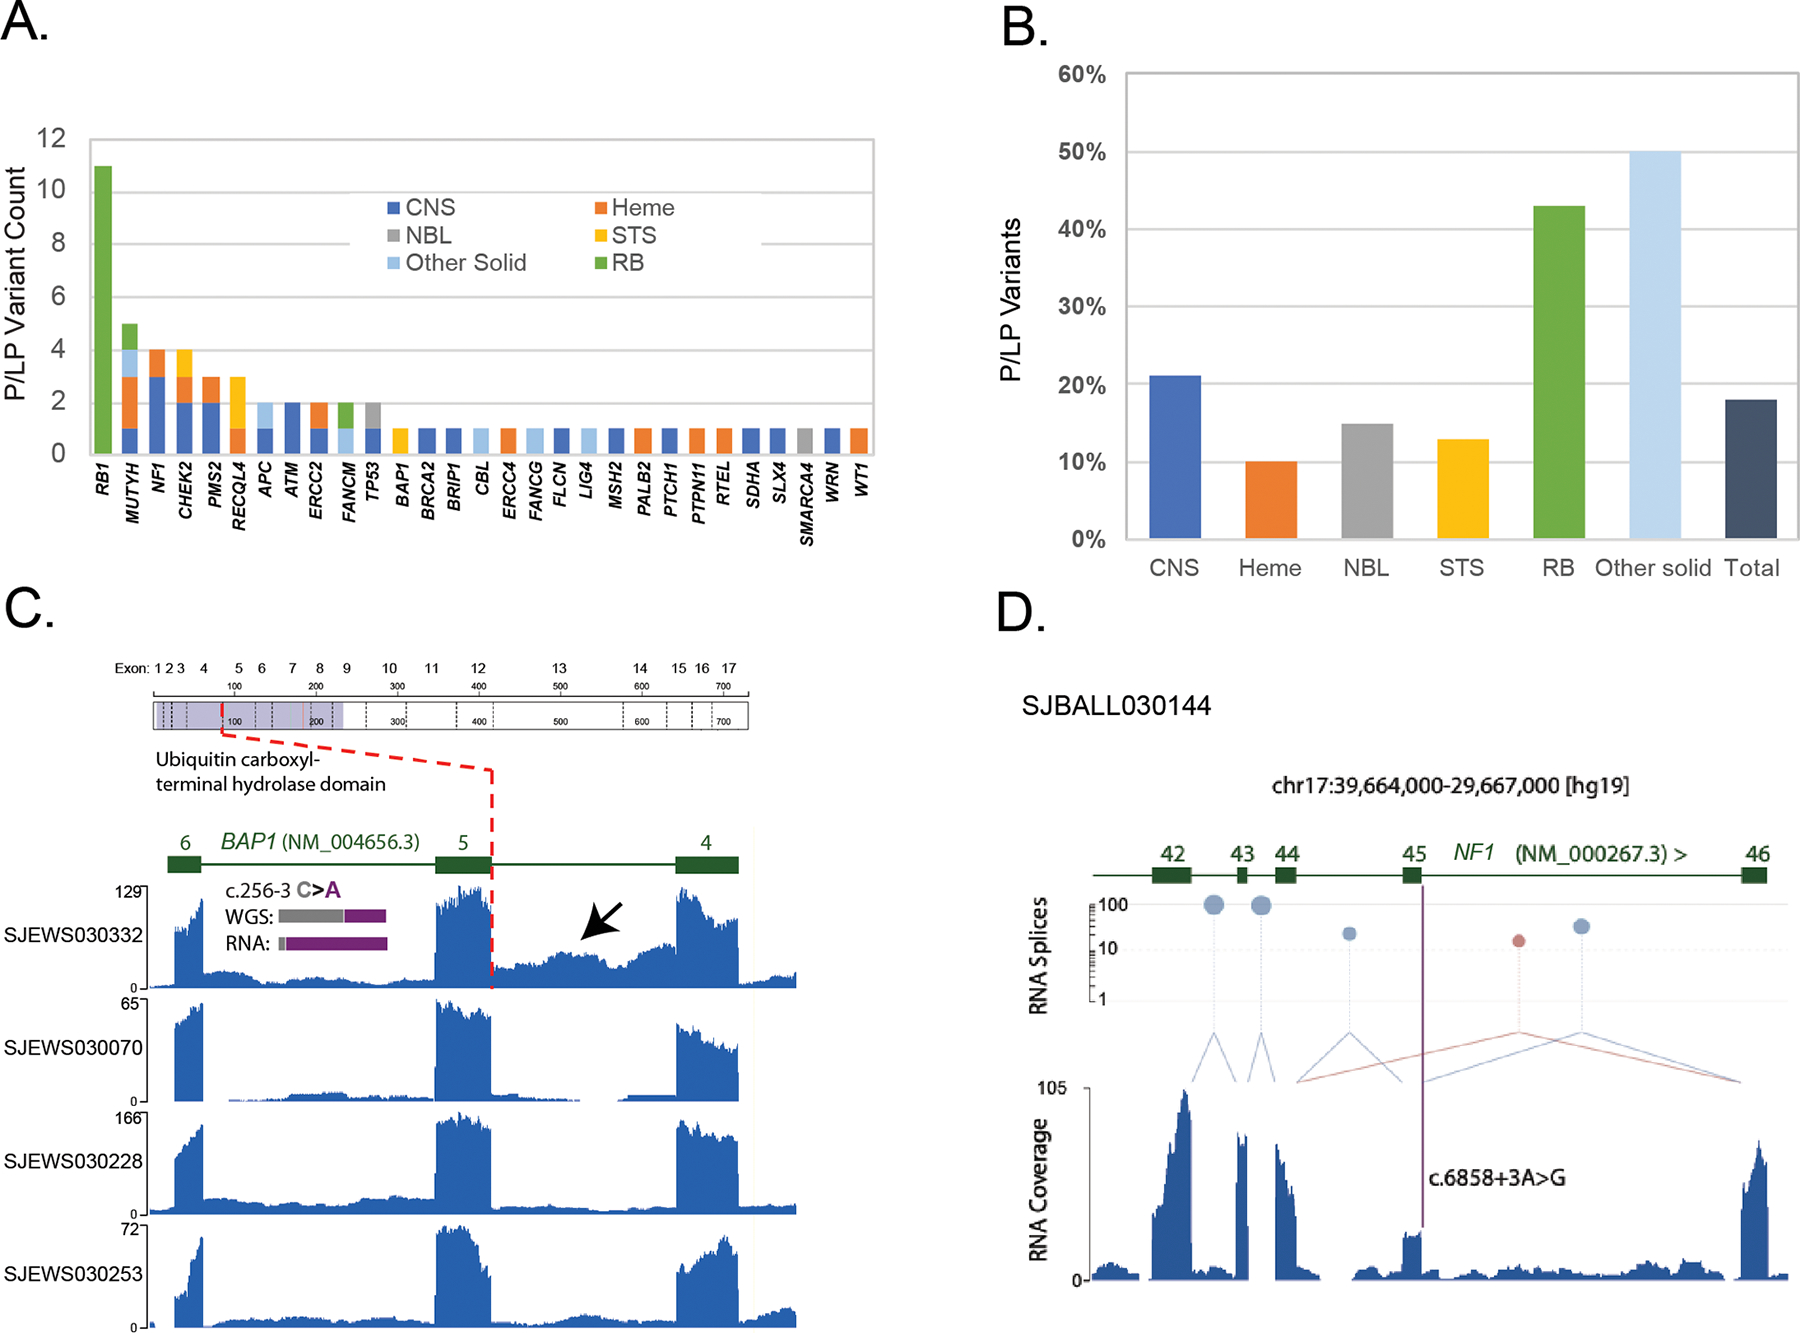
Figure 4. Germline variants and assessment of variant pathogenicity based on RNA data.

A. Numbers of germline P/LP variants, broken down by gene and tumor type. B. Proportions of germline P/LP variants, broken down by tumor type. C. BAP1 intron 4 retention in SJEWS030332 compared to other G4K Ewing sarcoma cases. Each blue histogram shows hg19-aligned RNA-Seq coverage relative to the BAP1 gene model in green (note that BAP1 is on the negative strand). The position of the exon five splice acceptor mutation is indicated by the red dotted line. Increased read coverage in the SJEWS030332 (bearing a mutation at the −3 position of exon 5) intron relative to the three other samples indicates intron 4 retention (black arrow). Inset histograms show the relative proportion of reference and variant alleles in tumor-derived WGS and RNA-Seq in grey and purple, respectively. Corresponding read counts are WGS: 32G/21T (40% variant allele) and RNA 2G/28T (93% variant allele). Above the RNA coverage plots a schematic of the BAP1 protein is shown with the location of the splice variant leading to protein truncation marked. D. NF1 exon 45 skipping in SJBALL030144. The blue histogram shows RNA-Seq coverage relative to the NF1 gene model in green. Canonical splices are shown as light blue links between exons and a non-canonical splice is shown in mauve. The height of mauve and blue lollypops is proportional to the number of splice junction reads detected plotted on a log scale on the y-axis. The purple bar indicates the position of the NF1 exon 45 splice acceptor mutation. Exon 45 expression is diminished relative to flanking exons and a non-canonical splice linking exons 44 and 46 is observed indicating an exon skipping event.
