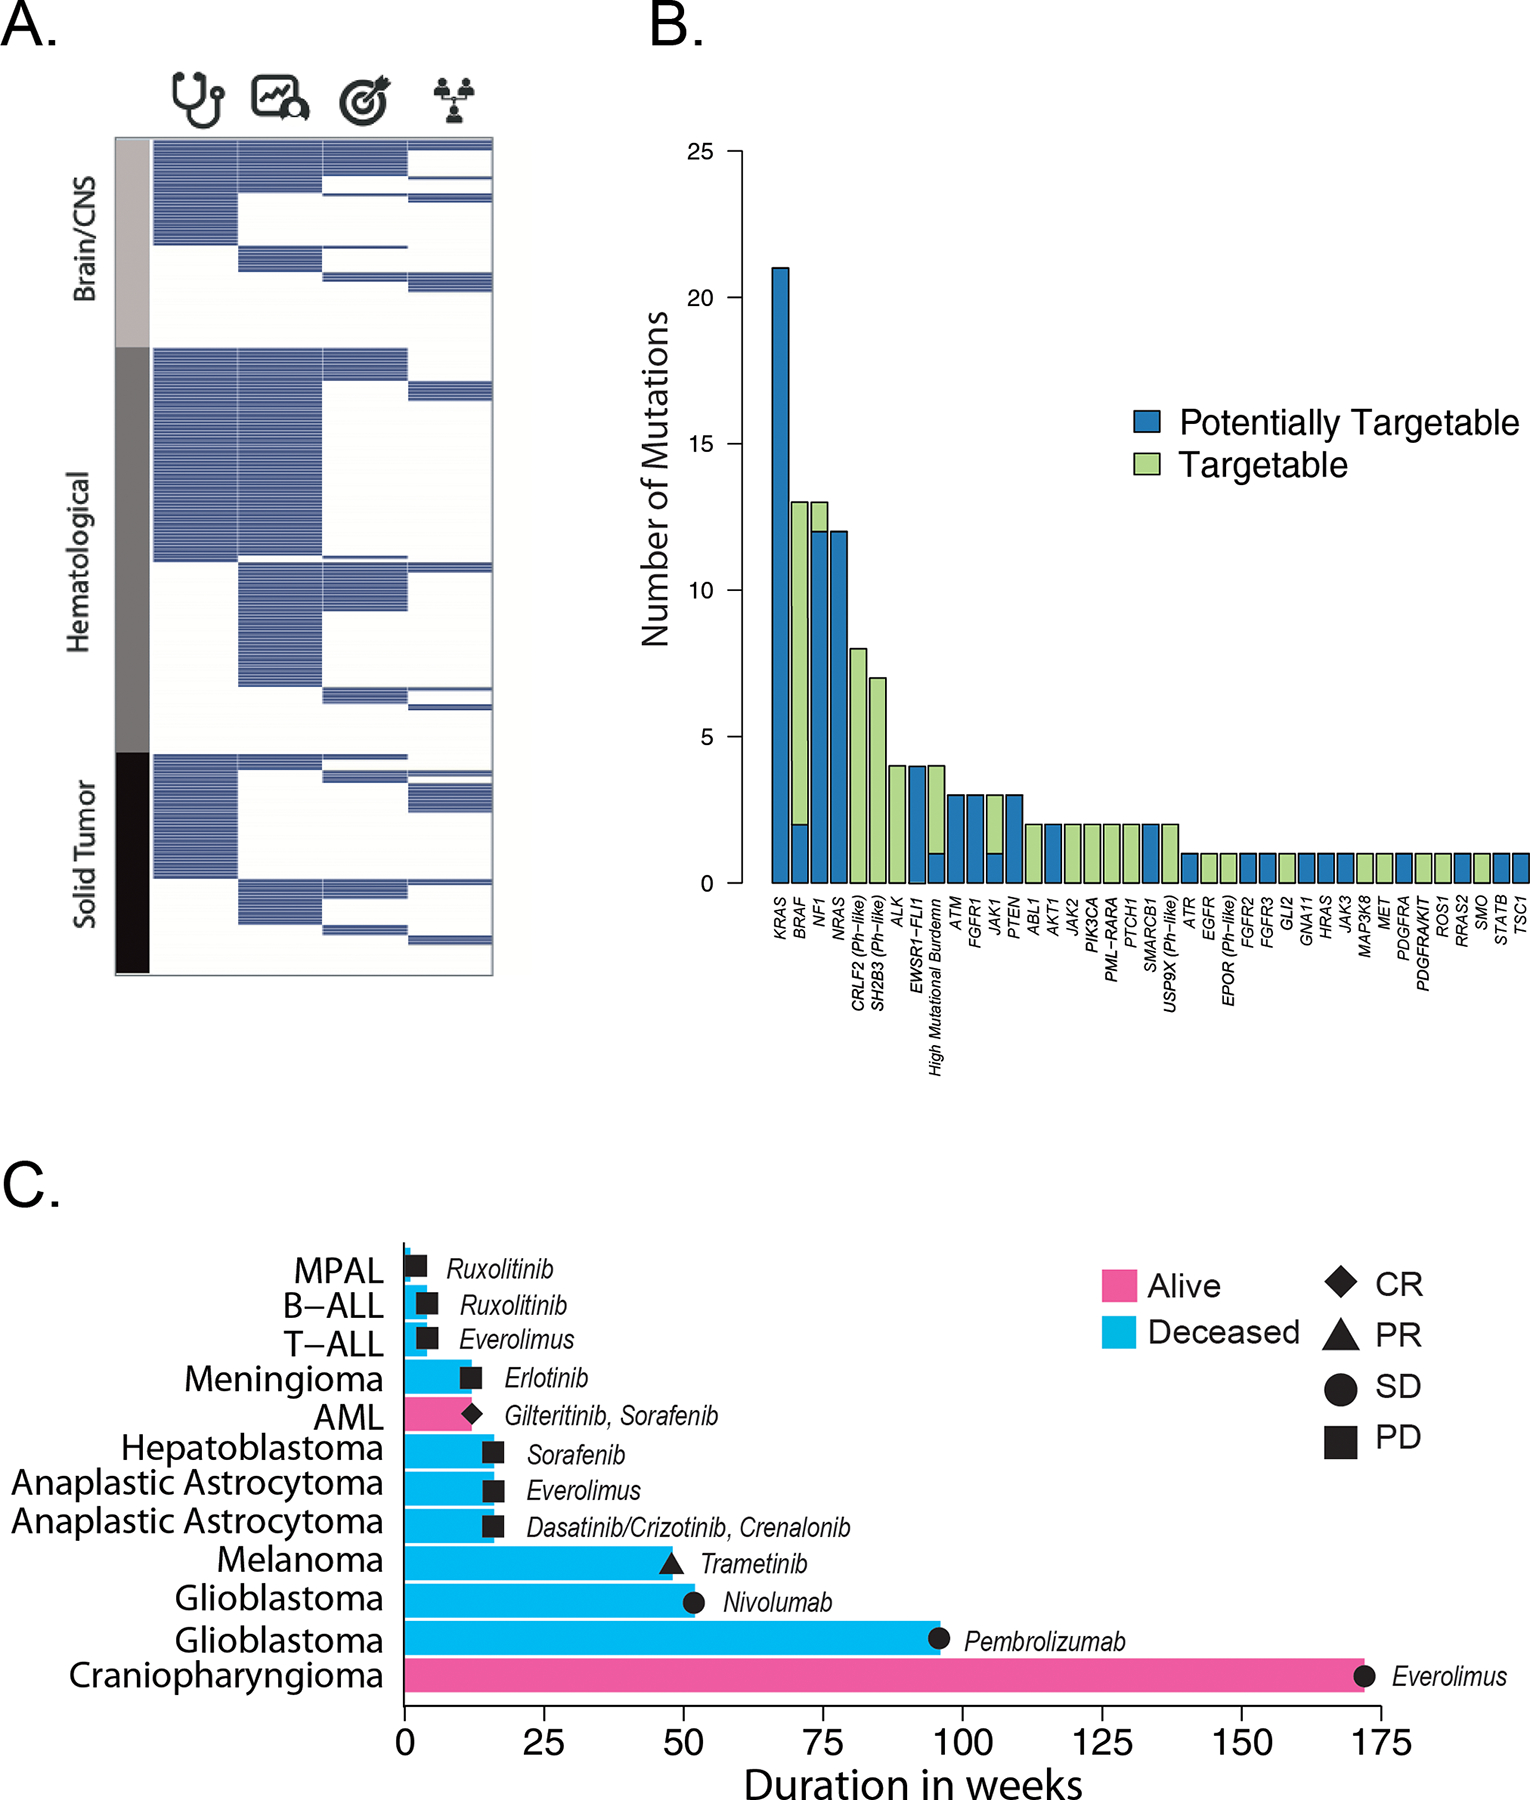
Figure 7. Clinically actionable findings.

A. Tile plot summarizing clinically actionable findings in the 253 patients who had both tumor and normal tissues sequenced. Each tumor is represented as a row and is grouped according to major tumor type. Columns represent the presence (blue) or absence (white) of a diagnostic (stethoscope), prognostic (patient chart), therapeutically-relevant (target) or cancer predisposing mutation (pedigree). B. Tumors with targetable (Tier 1 and 2, green) or potentially targetable (blue) lesions, categorized by the affected gene, identified by the three-platform sequencing approach. Additional information can be found in Supplemental Tables S2, S10. C. Swimmer plot depicting patients receiving a targeted therapy matched to their tumor genetic lesion. Each bar is one patient, with the disease as labeled. Pink bars, patient is alive; blue bars, patient is deceased. Best response on the targeted therapy is as labeled. CR, complete response; PR, partial response; SD stable disease; PD, progressive disease. The drugs used are labeled adjacent to each bar. See Supplemental Table S11 for further details. MPAL, mixed phenotype acute leukemia; B-ALL, B-acute lymphoblastic leukemia; T-ALL, T acute lymphoblastic leukemia; AML, acute myeloid leukemia.
