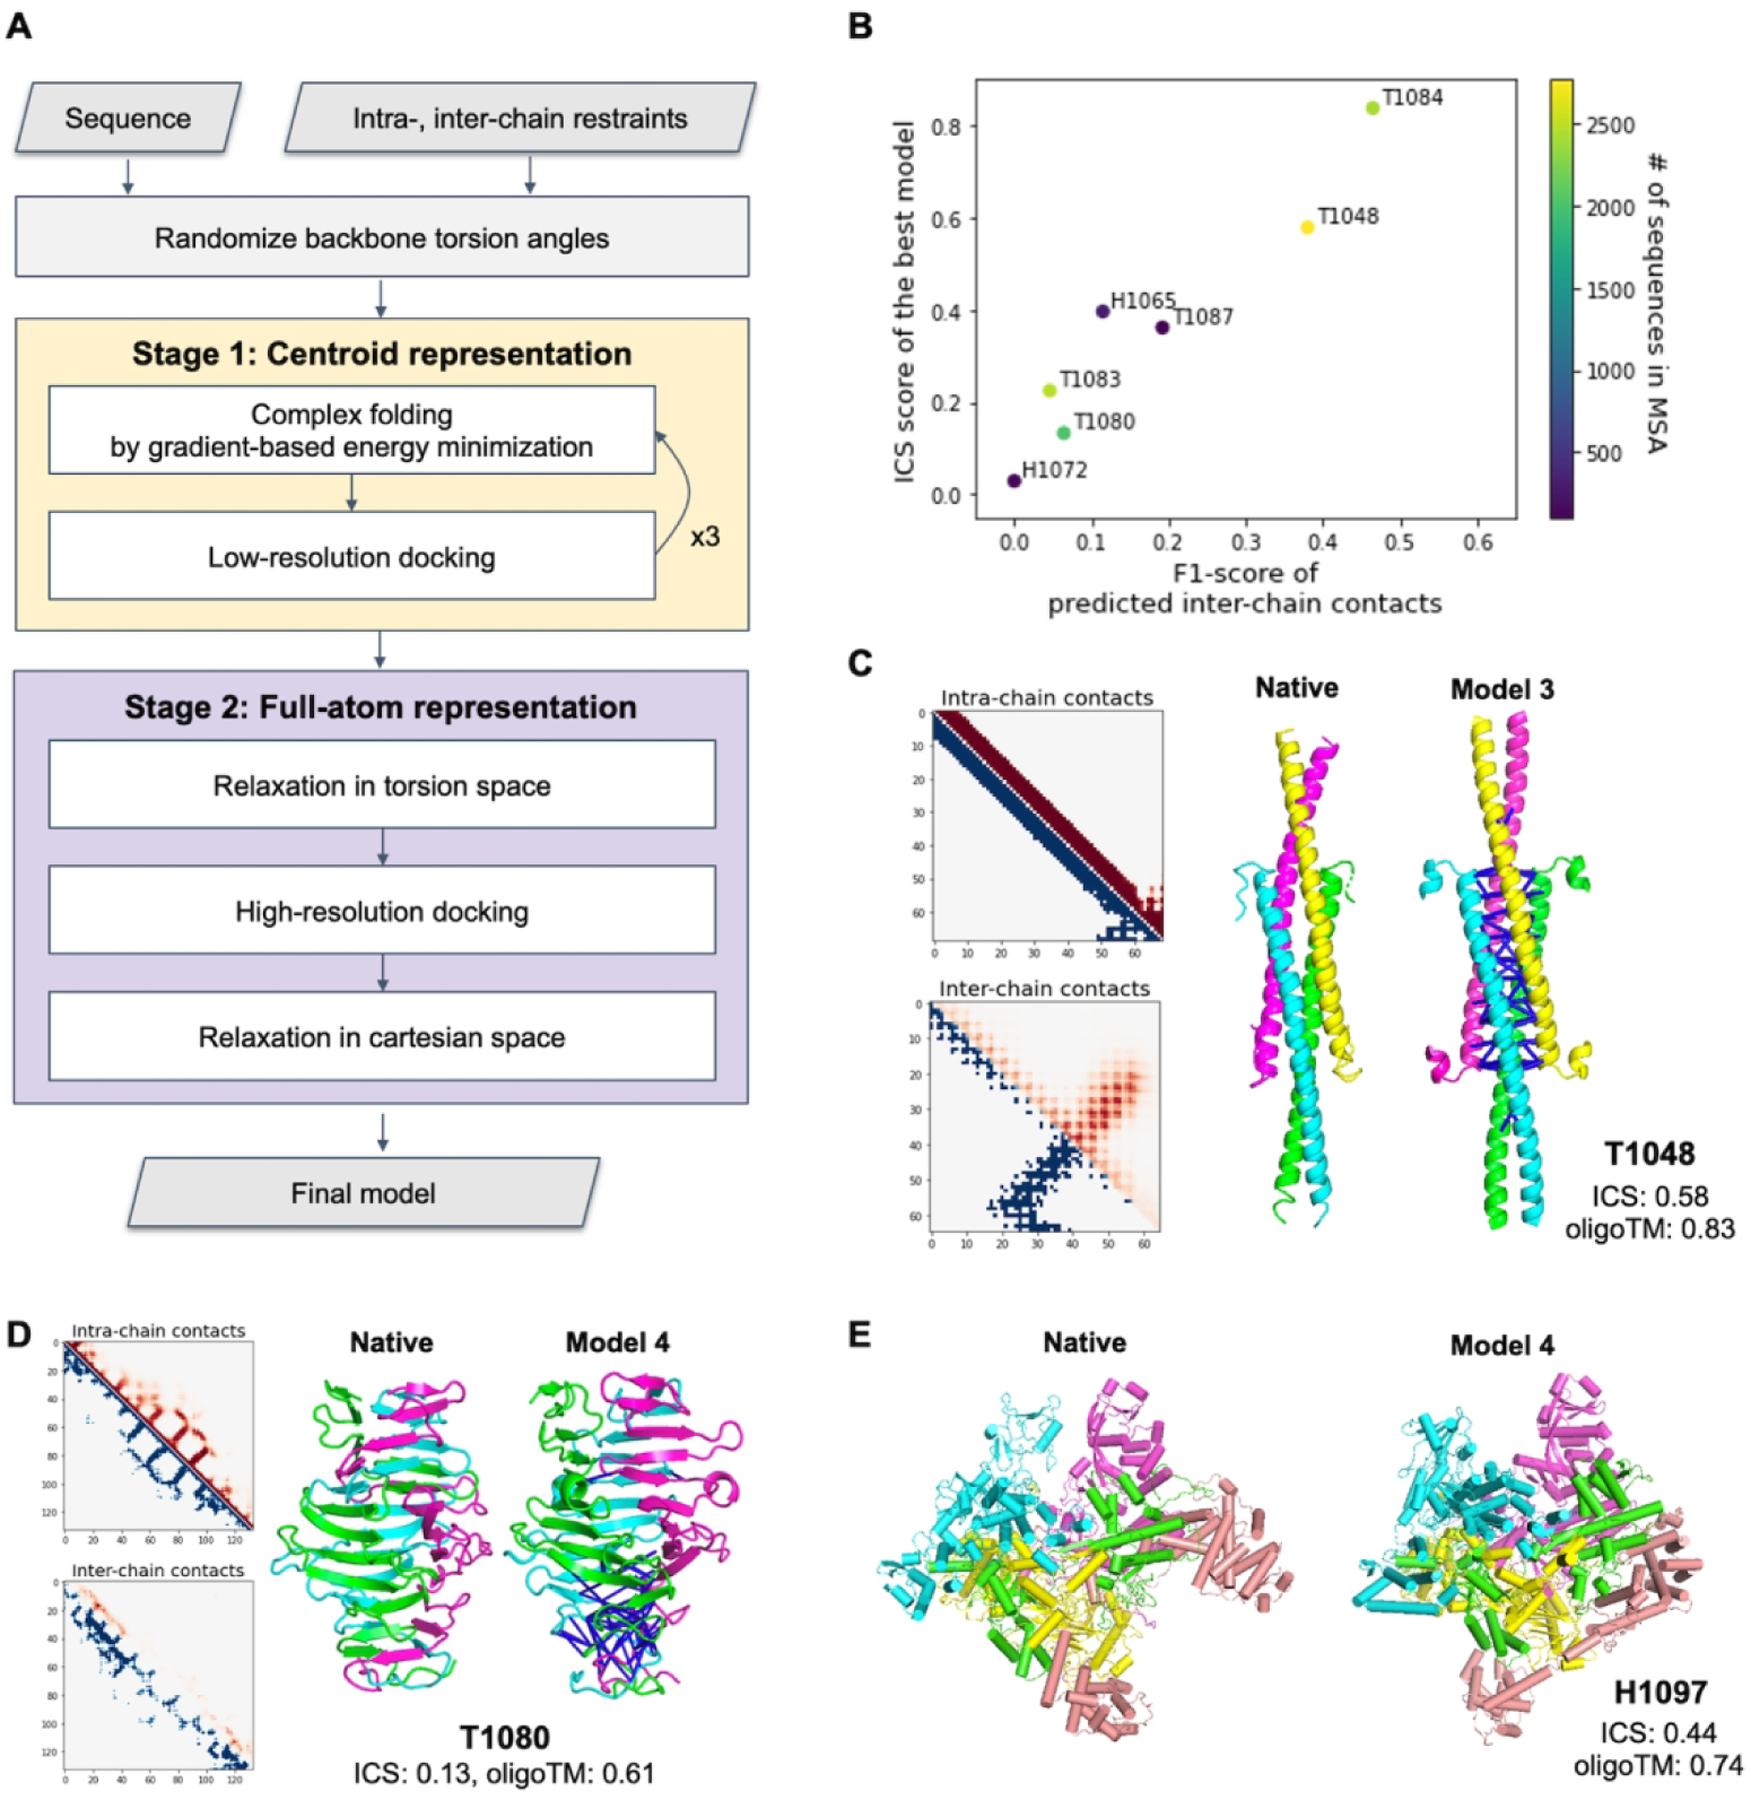
Figure 3.

Performance of the gradient-based fold-and-dock method. A) Schematic outline of the fold-and-dock procedure consisting of two stages: repetitive folding and docking in centroid representation followed by full-atom docking and relaxation. B) Correlation between the quality of predicted inter-chain contacts and that of modeled interfaces. C–D) Examples of successful predictions using gradient-based fold-and-dock methods with predicted inter-chain contacts. Predicted intra-chain distances and inter-chain contacts are shown in the upper diagonal (colored in red) of 2D maps while those from native structures are shown in the lower diagonal (colored in blue). The correctly predicted inter-chain contacts are shown as blue lines in the model structures. Both native and model structures are colored by chains. E) Native and the best prediction submitted as model 4 for H1097.
