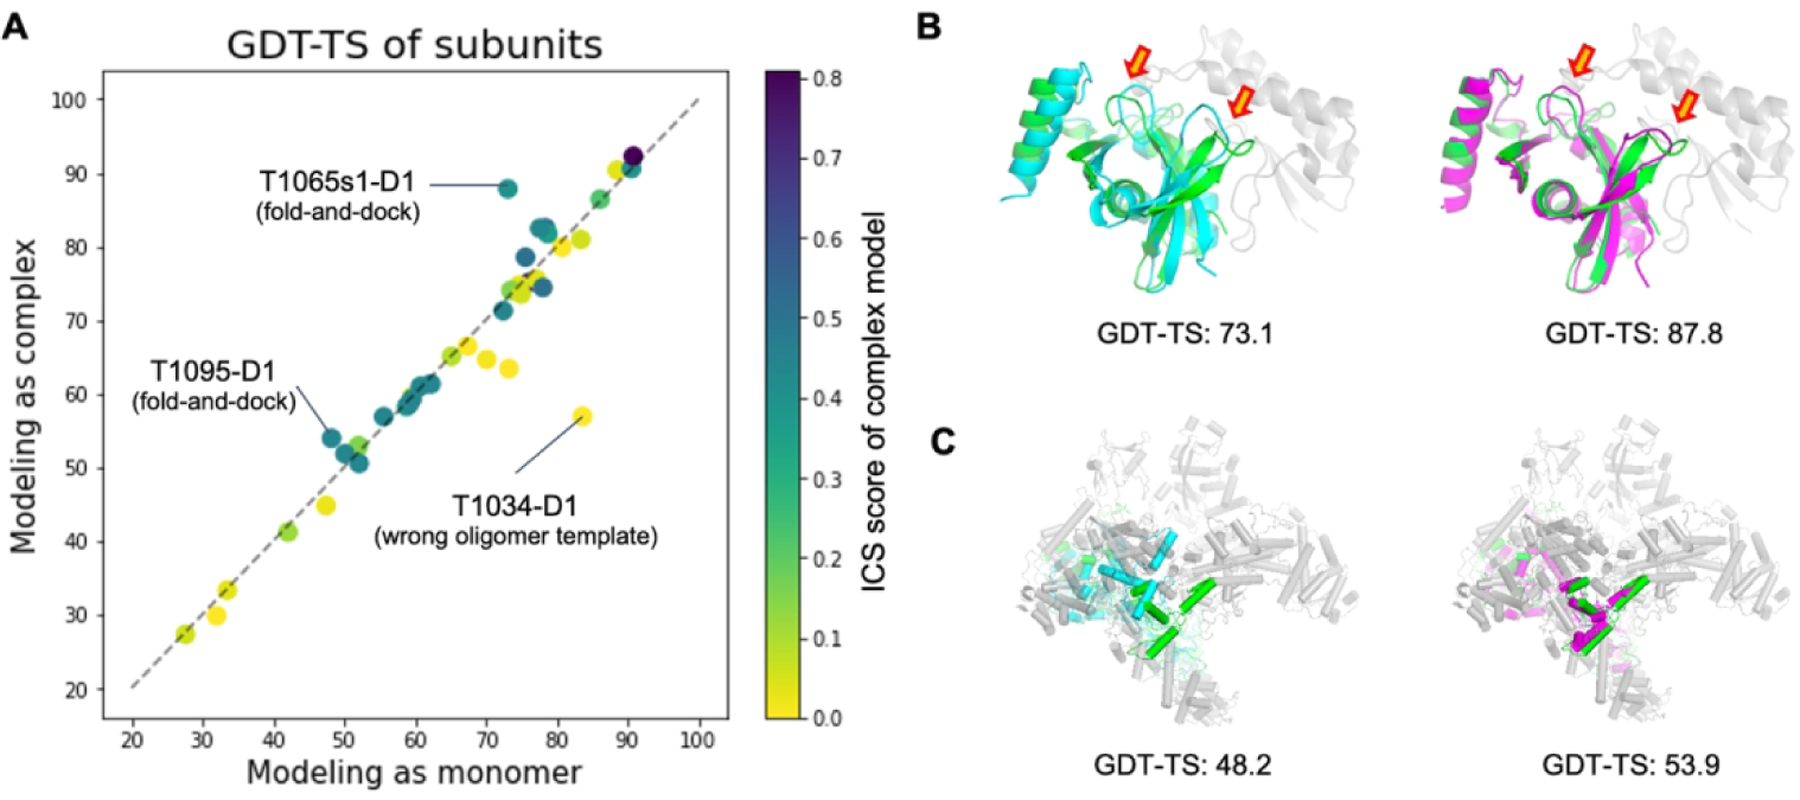
Figure 5.

Comparison of subunit structures modeled as complexes to those modeled as monomers. A) Head-to-head comparison of the subunit qualities in terms of the evaluation unit-wise GDT-TS score. Dots are colored by the ICS score of predicted complex structures. Panel B) and C) show two successful examples (T1065s1-D1 and T1095-D1, respectively). The native structure of the target subunit and its binding partners are shown in green and gray, respectively. The subunit structures predicted as a monomer are shown in cyan (left), while those predicted in oligomer contexts are colored in magenta (right).
