Figure 3.
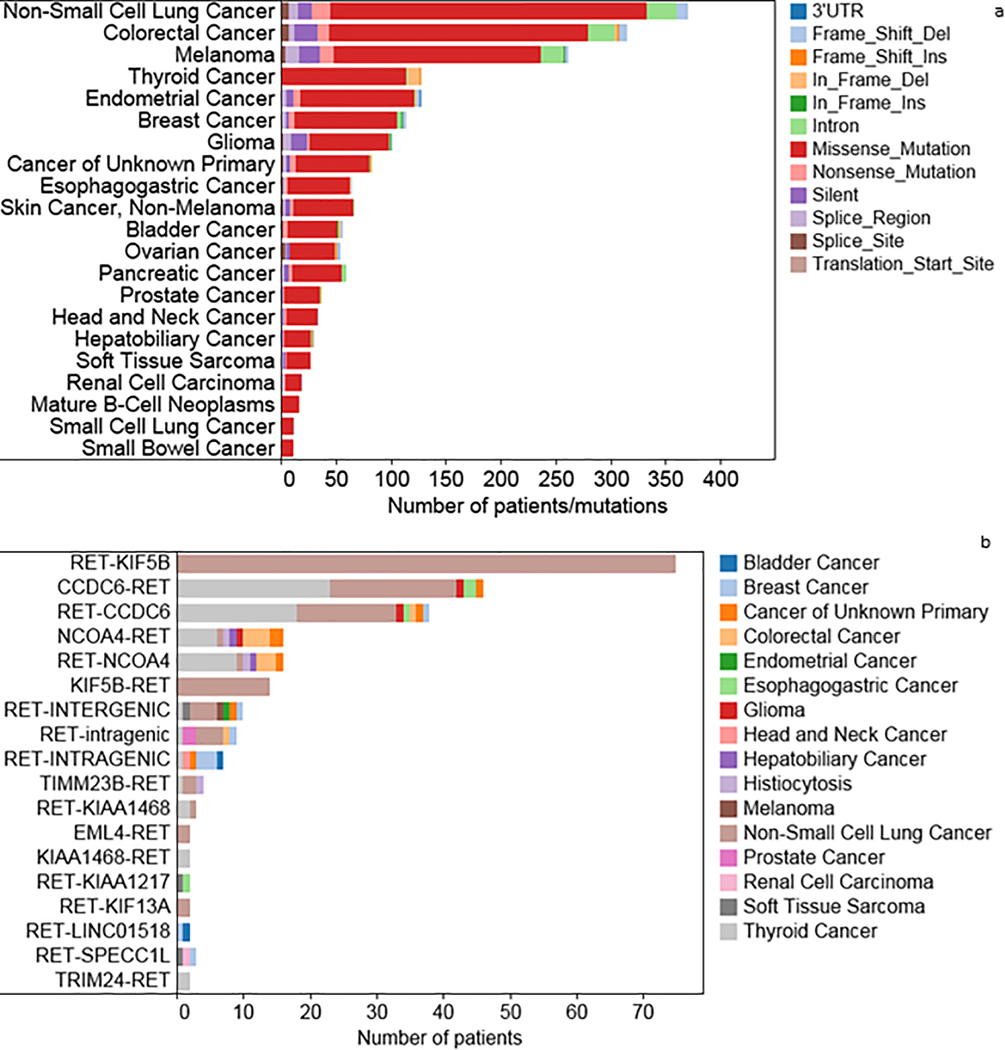
Figure 3A. Distribution of RET aberrations (excluding fusions) in AACR Genie database.
Figure 3A: Distribution of frequency of RET alterations in AACR distributed by tumor histology, correlates with Supplemental Table 2
Figure 3B. Distribution of RET fusions in AACR Genie database.
Figure 3B: Distribution of frequency of RET fusions in AACR distributed by type of fusion

