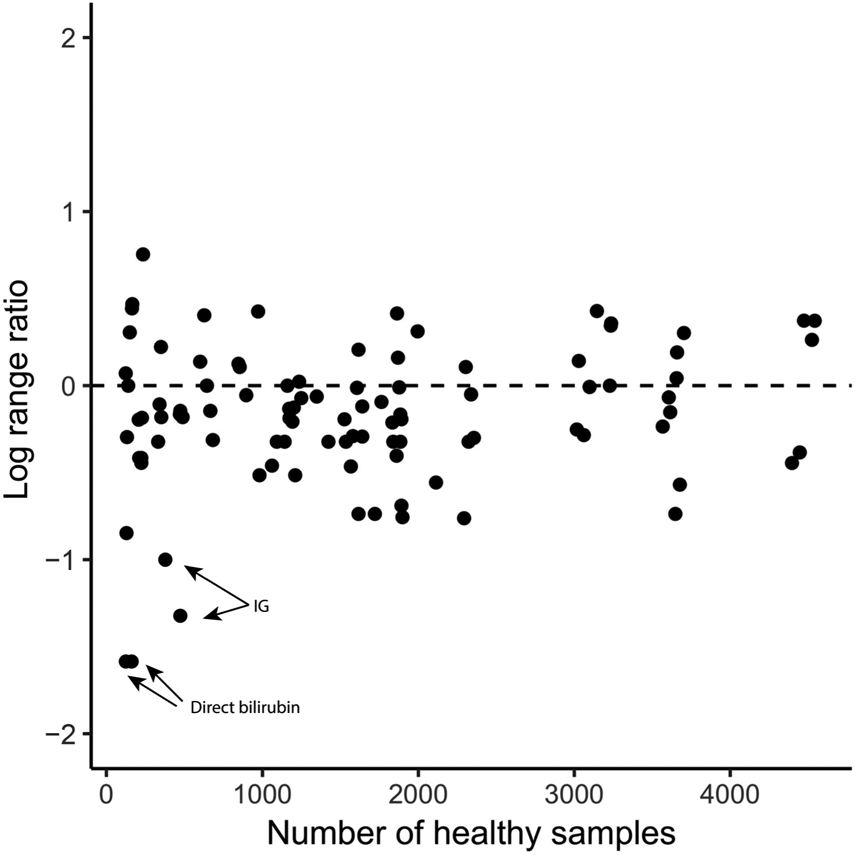
Fig. 1. EHR-calibrated reference intervals comparison.

Scatter plot of the number of healthy samples vs log2 of the ratio of original reference interval size and EHR-based reference interval size. A point above the horizontal line represents a laboratory test in which the EHR-calibrated reference interval is larger than the original. For example, 2 data points on the bottom left size represent the 2 laboratory tests to measure direct bilirubin levels for male and female individuals. For these 2 laboratory tests, the reference interval is ≤0.3 mg/dL, whereas the EHR-based reference intervals were found to be ≤0.1 mg/dL.
