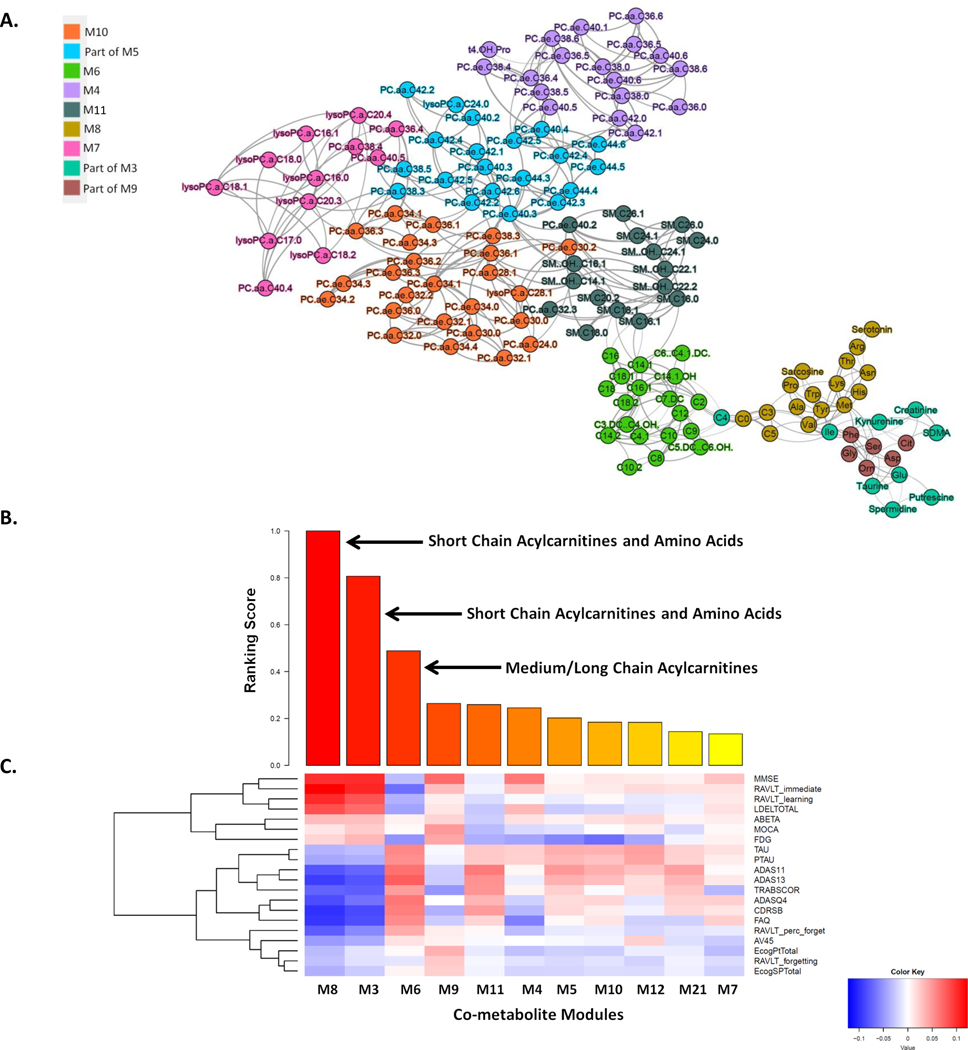
Figure 1. Multiscale metabolite co-expression network analysis of the blood metabolomic data in the ADNI.
(A) The global metabolite co-expression network. Two parent modules M3 and M5 are not shown here. (B) Rank-ordered metabolite modules by the extent of association to the clinical outcomes. (C) Heatmap of the correlations between clinical/cognitive AD-pathology related traits and metabolite modules. Cognitive and pathological traits are shown on the right axis while the metabolite modules are shown at the bottom axis. The intensity of the color in each cell indicates the magnitude of the Spearman’s rank correlation coefficient between the corresponding row and column variables, for those correlations with adjusted p values <0.05. Red and blue colors indicate positive and negative correlations, respectively.

