
FIG. 6.
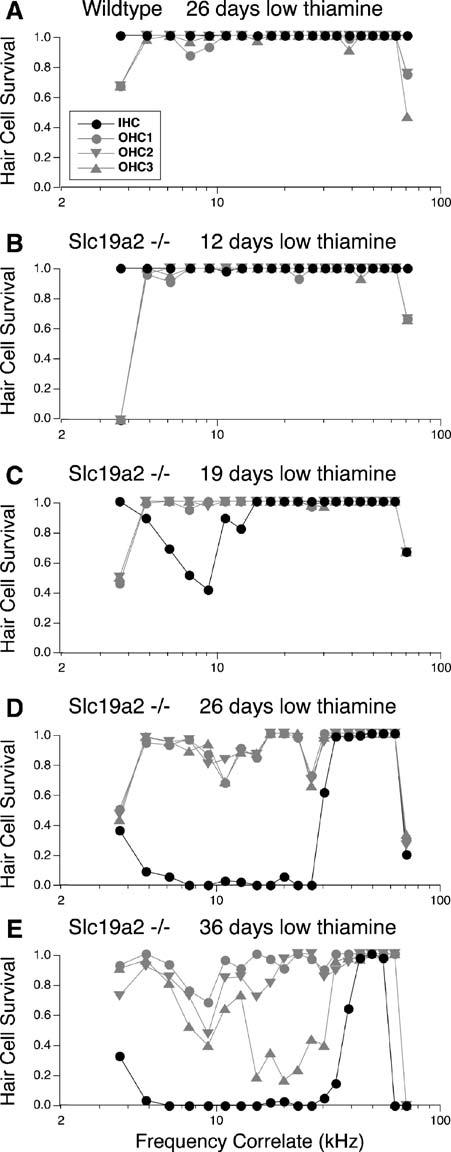
Patterns of hair cell loss in representative mice from the cohort in Figure 1: i.e., animals maintained on a low-thiamine diet for variable periods (see header to each panel). (A) Data from a wild-type ear, (B–E) data from four transporter-null ears. Hair cell survival is plotted as a fraction: a value of 1.0 means that all hair cells were present. Data in each case are averaged over bins corresponding to 5% of total cochlear length. Cochlear position is translated into frequency according to a map for the mouse cochlea (Muller et al. 2005). Symbol key in (A) applies to all panels.