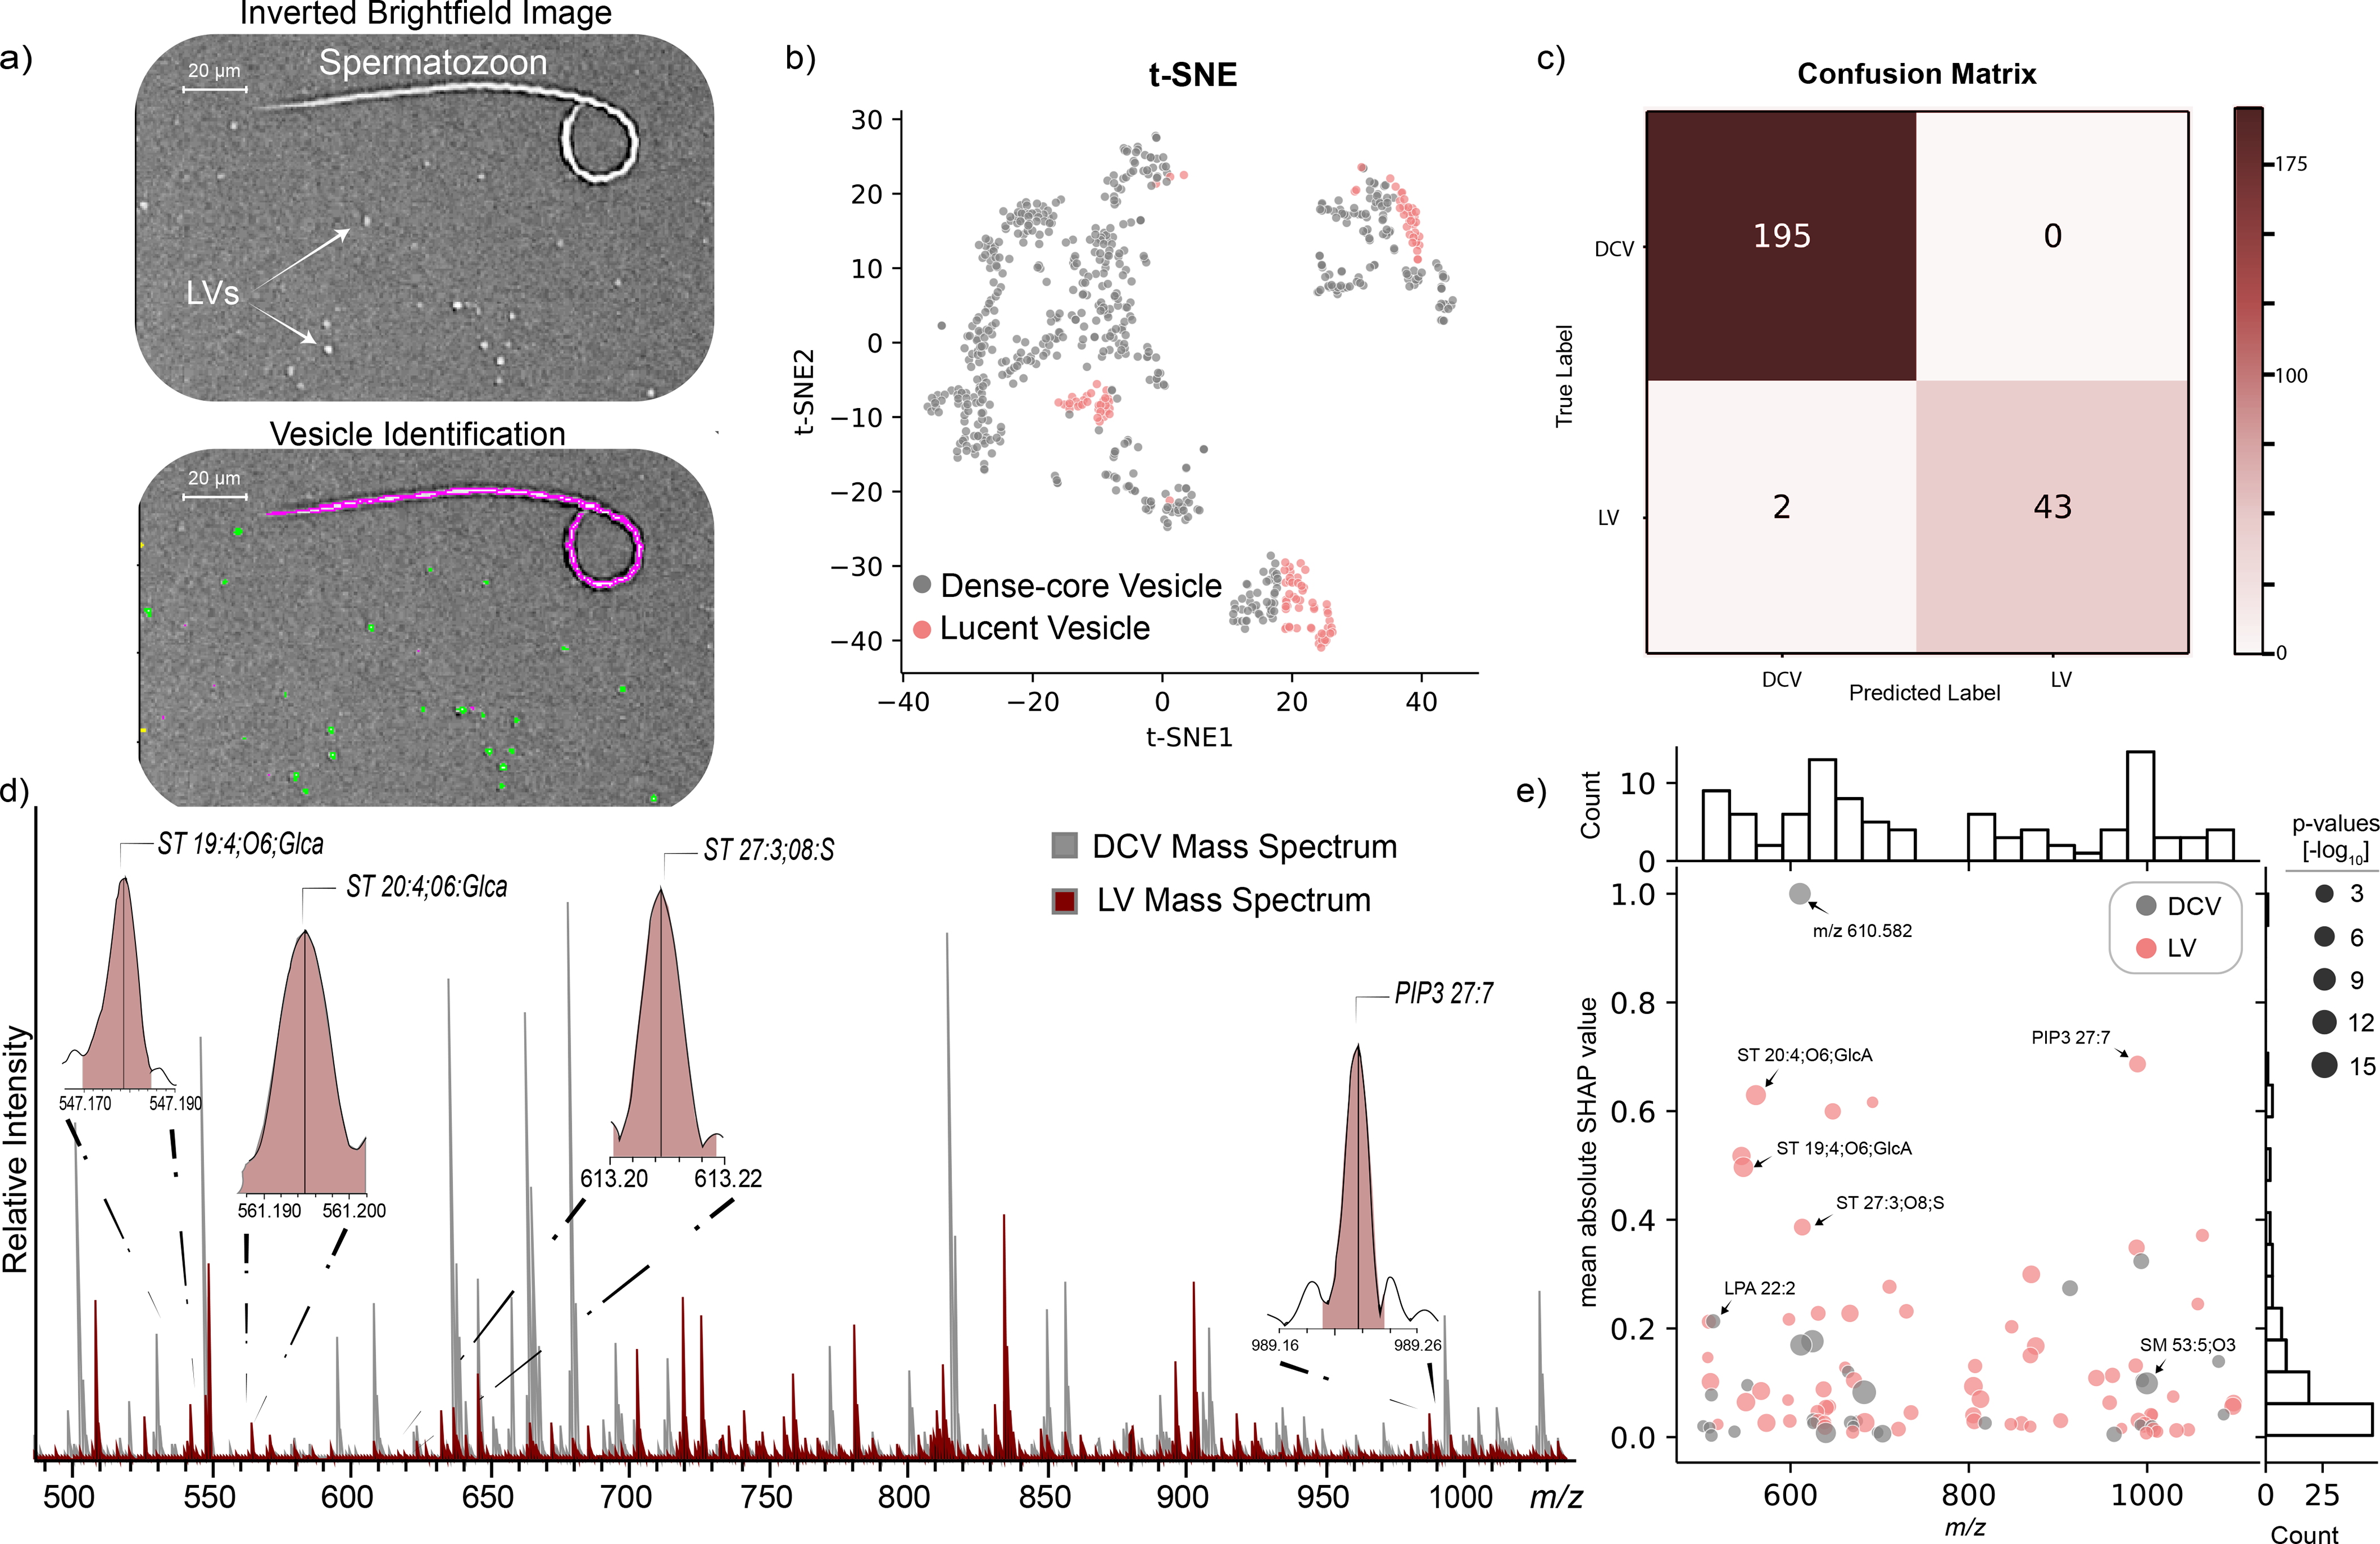
Fig. 3:

Comparison between two distinct vesicle types, LVs and DCVs. (a, top) Digitally inverted brightfield image showing LVs distributed across the glass slide. (a, bottom) Modification of the image-processing pipeline allows multiple morphologically distinct objects to be identified and added or removed for subsequent analysis. Green areas represent objects accepted for analysis. Magenta outline represents an object (here a spermatozoon) removed from analysis. A small number of spermatozoa (annotated) typically collected during RH LV sample preparation were used to demonstrate the effectiveness of our object filtering approach. A total of 123 LVs were measured from the same three biological replicates used in the DCV isolation. b) t-SNE was performed on the initial dataset for visualization of LVs and DCVs using all mass spectral features. c) Confusion matrix of the prediction on the test data using a 3-fold validation. d) Representative LV mass spectrum (red) overlaid on a representative DCV mass spectrum (grey). Representative spectra were not preprocessed. A subset of mass spectral features determined important via SHAP are annotated in the LV mass spectrum. e) Mass spectral feature contribution plot showing the importance of features to the vesicle classification task across m/z 500–1,100 on the x-axis. The y-axis shows the mean absolute SHAP value for the corresponding m/z feature (normalized between 0 and 1). Grey dots represent features with elevated mean signal intensities in DCVs and pink dots represent features with elevated mean signal intensities in LVs. The different sized dots represent the respective p-values (two-sided Wilcoxon rank-sum test) for each corresponding feature.
