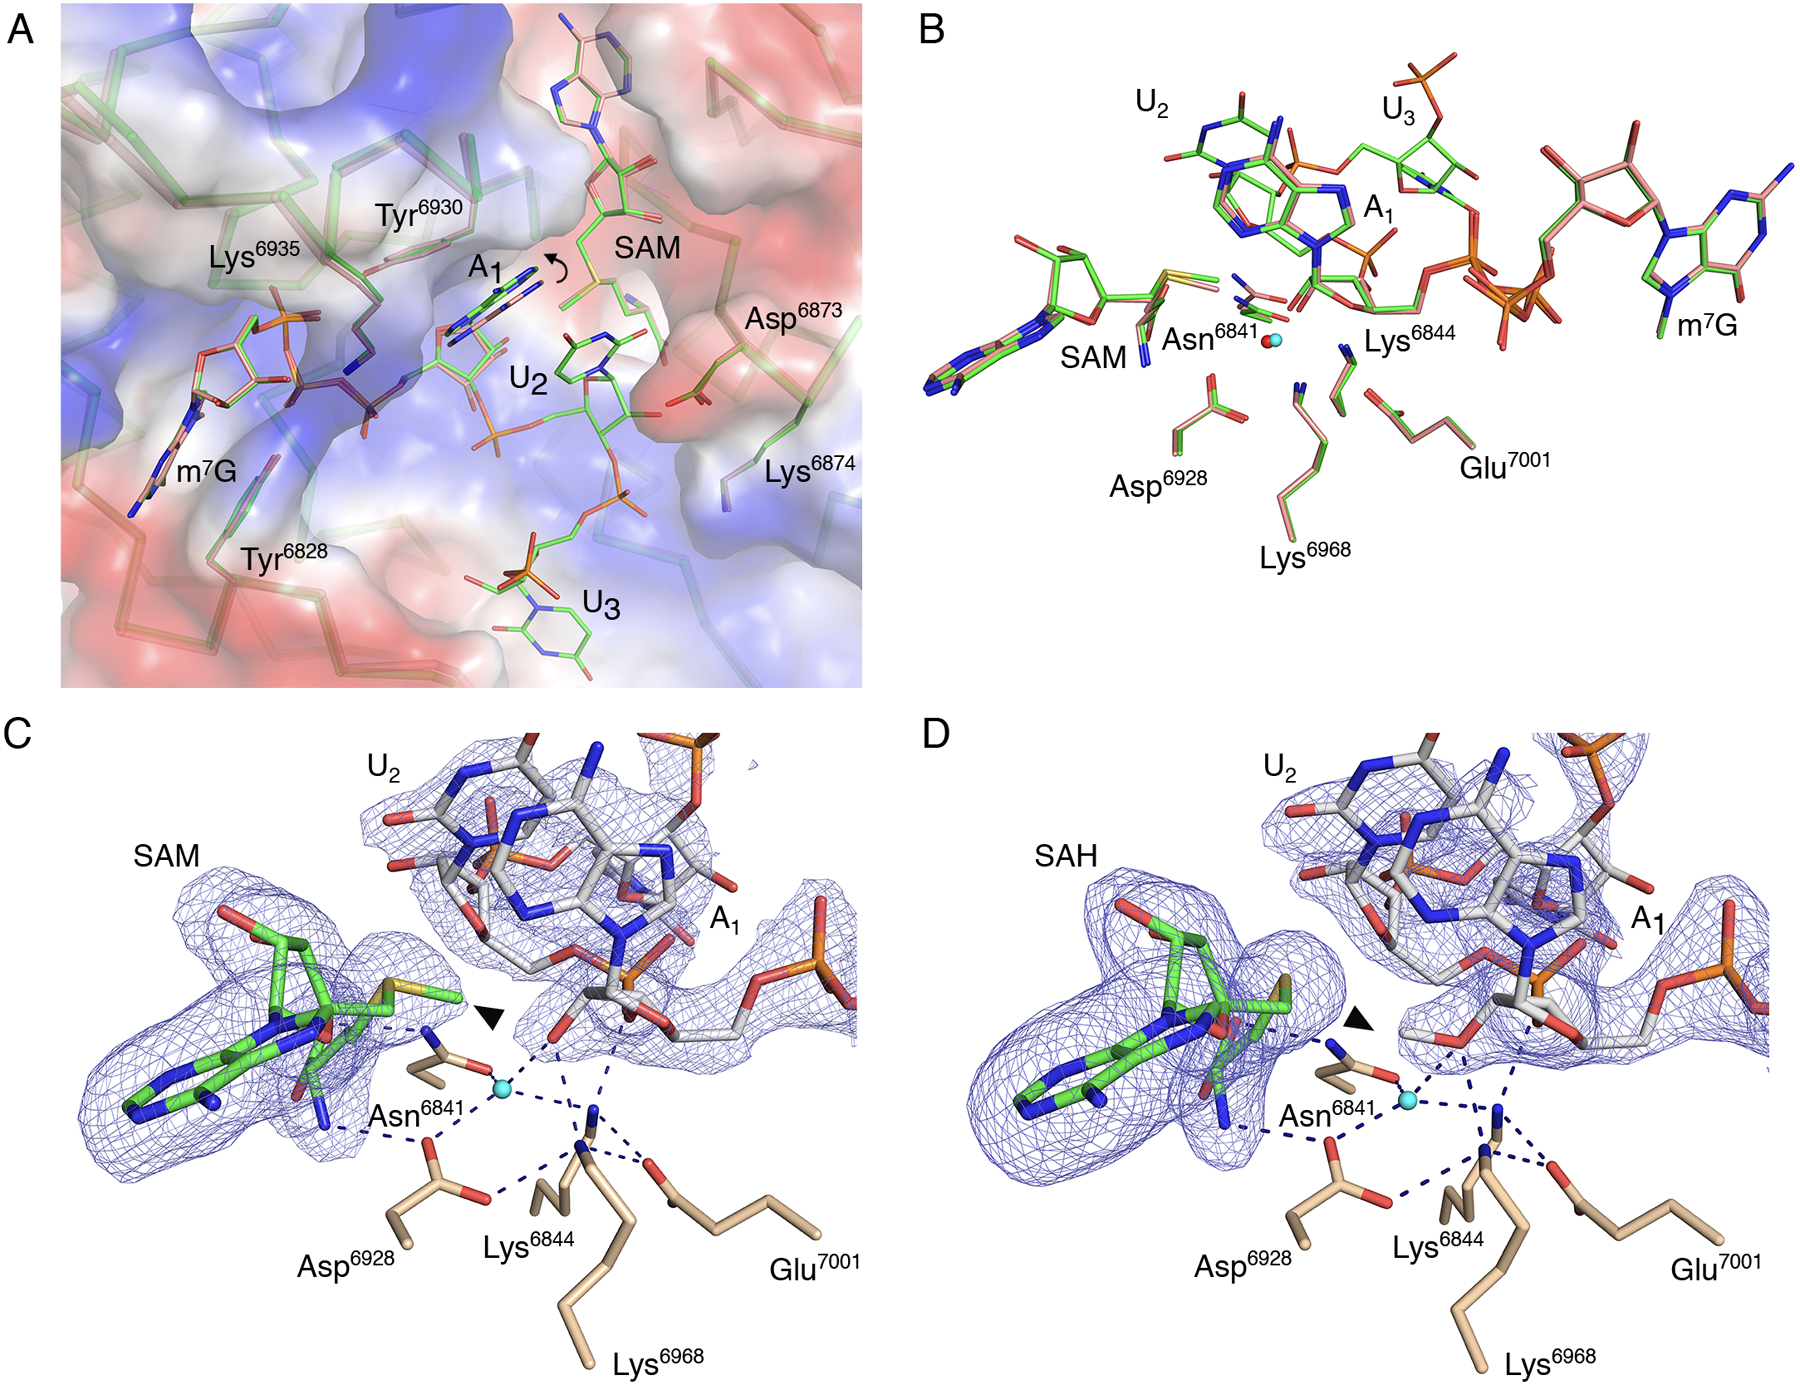
Fig. 2. The catalytic site of the SARS-CoV-2 2′-O-MTase.

(A) Superimposition of nsp16 with the Cap-0 analog (PDB 6WVN, pink) and nsp16 with the Cap-0-RNA (PDB 7JYY, green) structures with plotted electrostatic surface shown in blue (positive charge) and red (negative charge). Selected residues of nsp16, SAM, the Cap-0 analog, and Cap-0-RNA are labeled and shown as sticks. Carbons are in salmon and green for Cap-0 analog and Cap-0-RNA, respectively, with oxygens in red, nitrogens in blue, and sulfurs in yellow. Repositioning of the A1 base is marked with a curved arrow. (B) Catalytic residues of nsp16, Cap-0 analog, Cap-0-RNA, and conserved water for the same structures and same color scheme as in (A), with waters shown as small spheres in red and cyan for structures 6WVN and 7JYY, respectively. (C and D). Wall-eyed pseudo-stereo view of the active sites for complexes of (C) nsp16-nsp10 with Cap-0-RNA and SAM (PDB 7JYY) and (D) nsp16-nsp10 with Cap-1-RNA/SAH (PDB 7L6R). The catalytic site residues, SAM, and capped RNAs are labeled and shown as stick models with atoms colored in beige, green, and grey for carbons of nsp16, SAM, and capped RNA, respectively, with red for oxygens, blue for nitrogens, yellow for sulfurs. Conserved catalytic waters are shown as cyan spheres, hydrogen bond interactions as black, dashed lines, and the omit |Fo-Fc| electron density maps contoured at the 3σ level as blue mesh. The methyl group of SAM and Cap-1-RNA are marked with black triangles.
