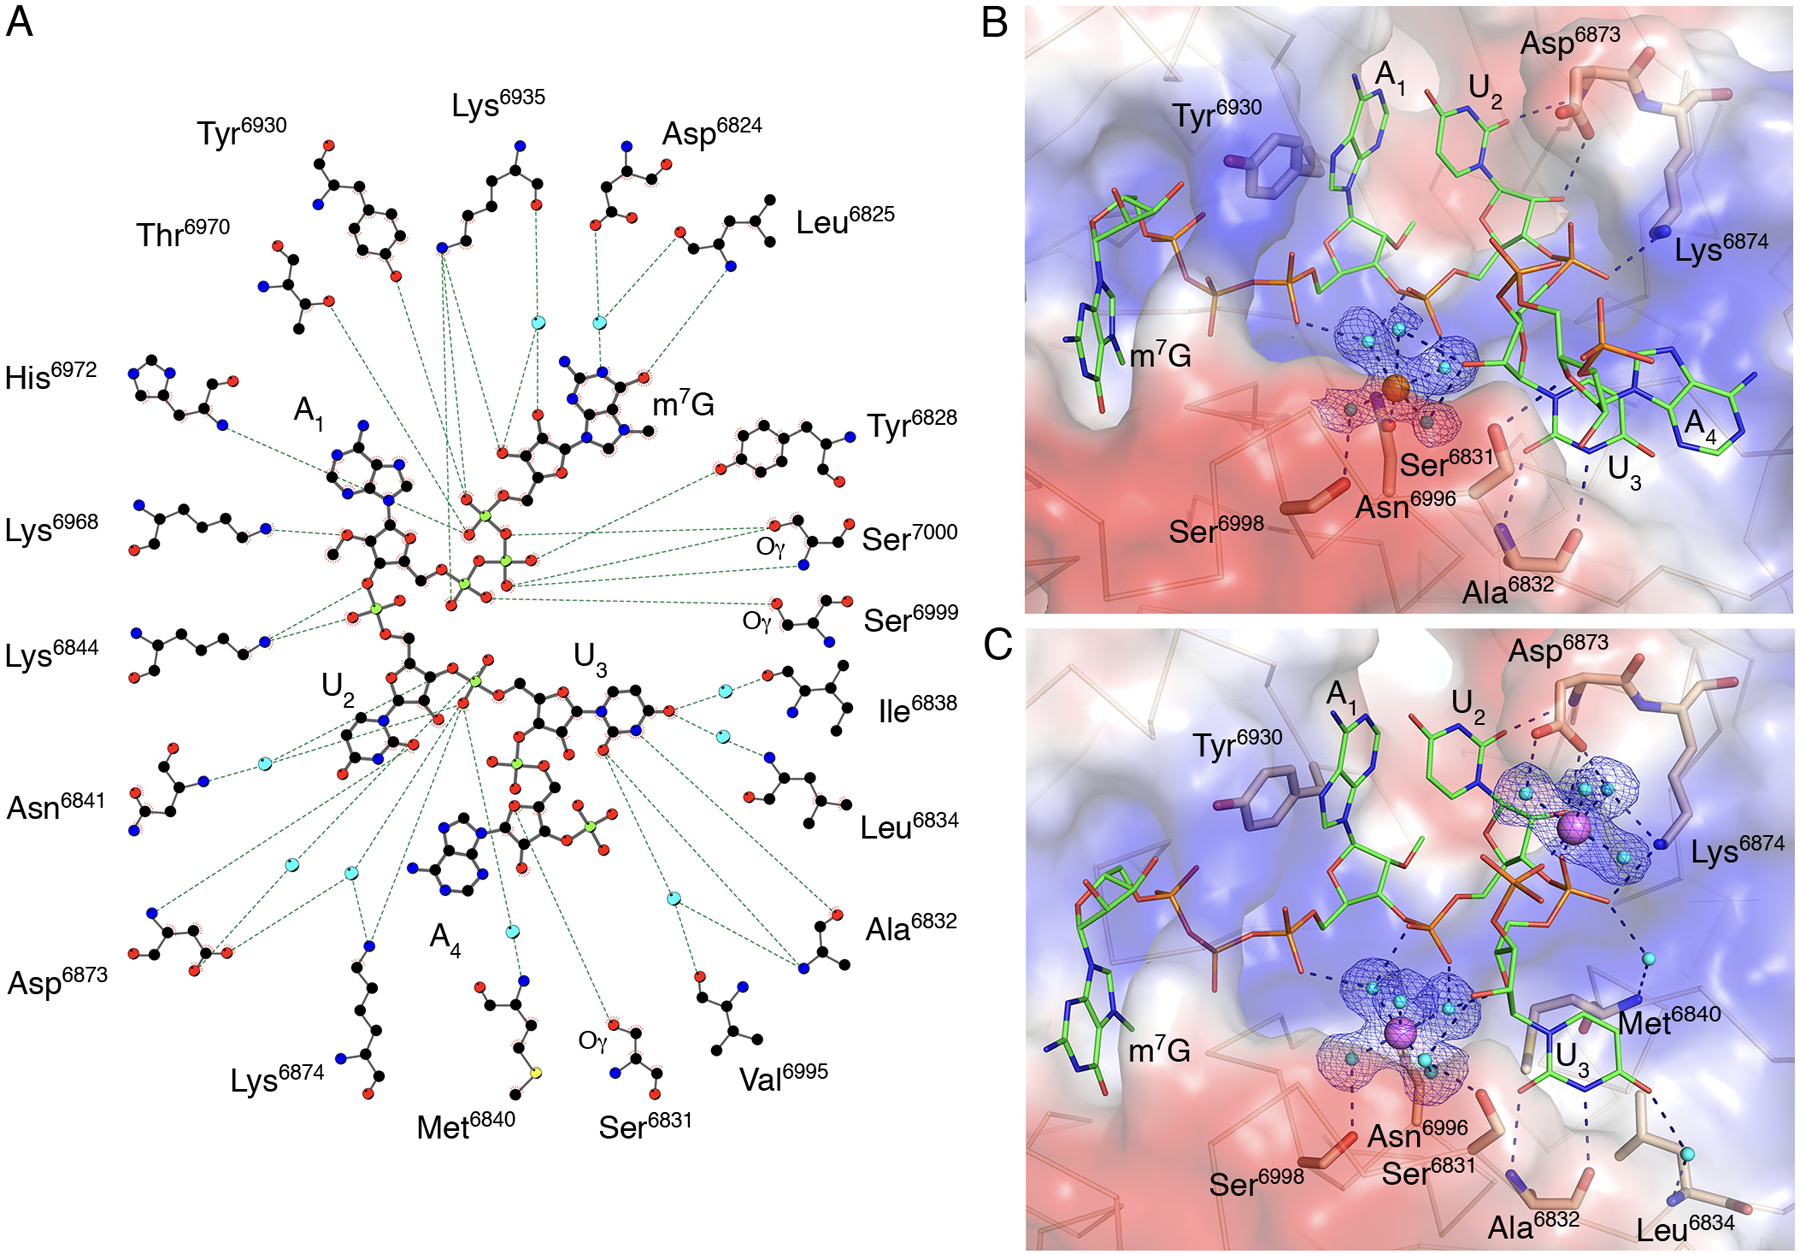
Fig. 3. Close alignment of the 2′-OH and methyl group of SAM in presence of RNA.

(A) A ball-and-stick representation of the hydrogen bonding network (dashed lines) between m7GpppA-RNA and nsp16 residues in Crystal #2. Carbons are shown in black, nitrogens in blue, oxygens in red, phosphates in light green, sulfurs in yellow, and waters in cyan. (B and C) A detailed view of the hydration sphere of (B) Mn2+ (orange sphere) in Crystal #2 and (C) Mg2+ (purple spheres) in Crystal #3, mapped on the electrostatic surface of nsp16 (blue and red) and their interactions with water (cyan spheres) and nsp16 residues (beige sticks). The Cap-1-RNA is represented as sticks, with carbons in green, oxygens in red, nitrogens in blue, and phosphates in orange. Hydrogen bond interactions are shown as black dashed lines and the omit electron density maps as blue mesh.
