
Figure 3. Correlation of Steroid Levels in Serum and Metastatic Tissue Before and After Treatment with Abiraterone Acetate plus Prednisone.
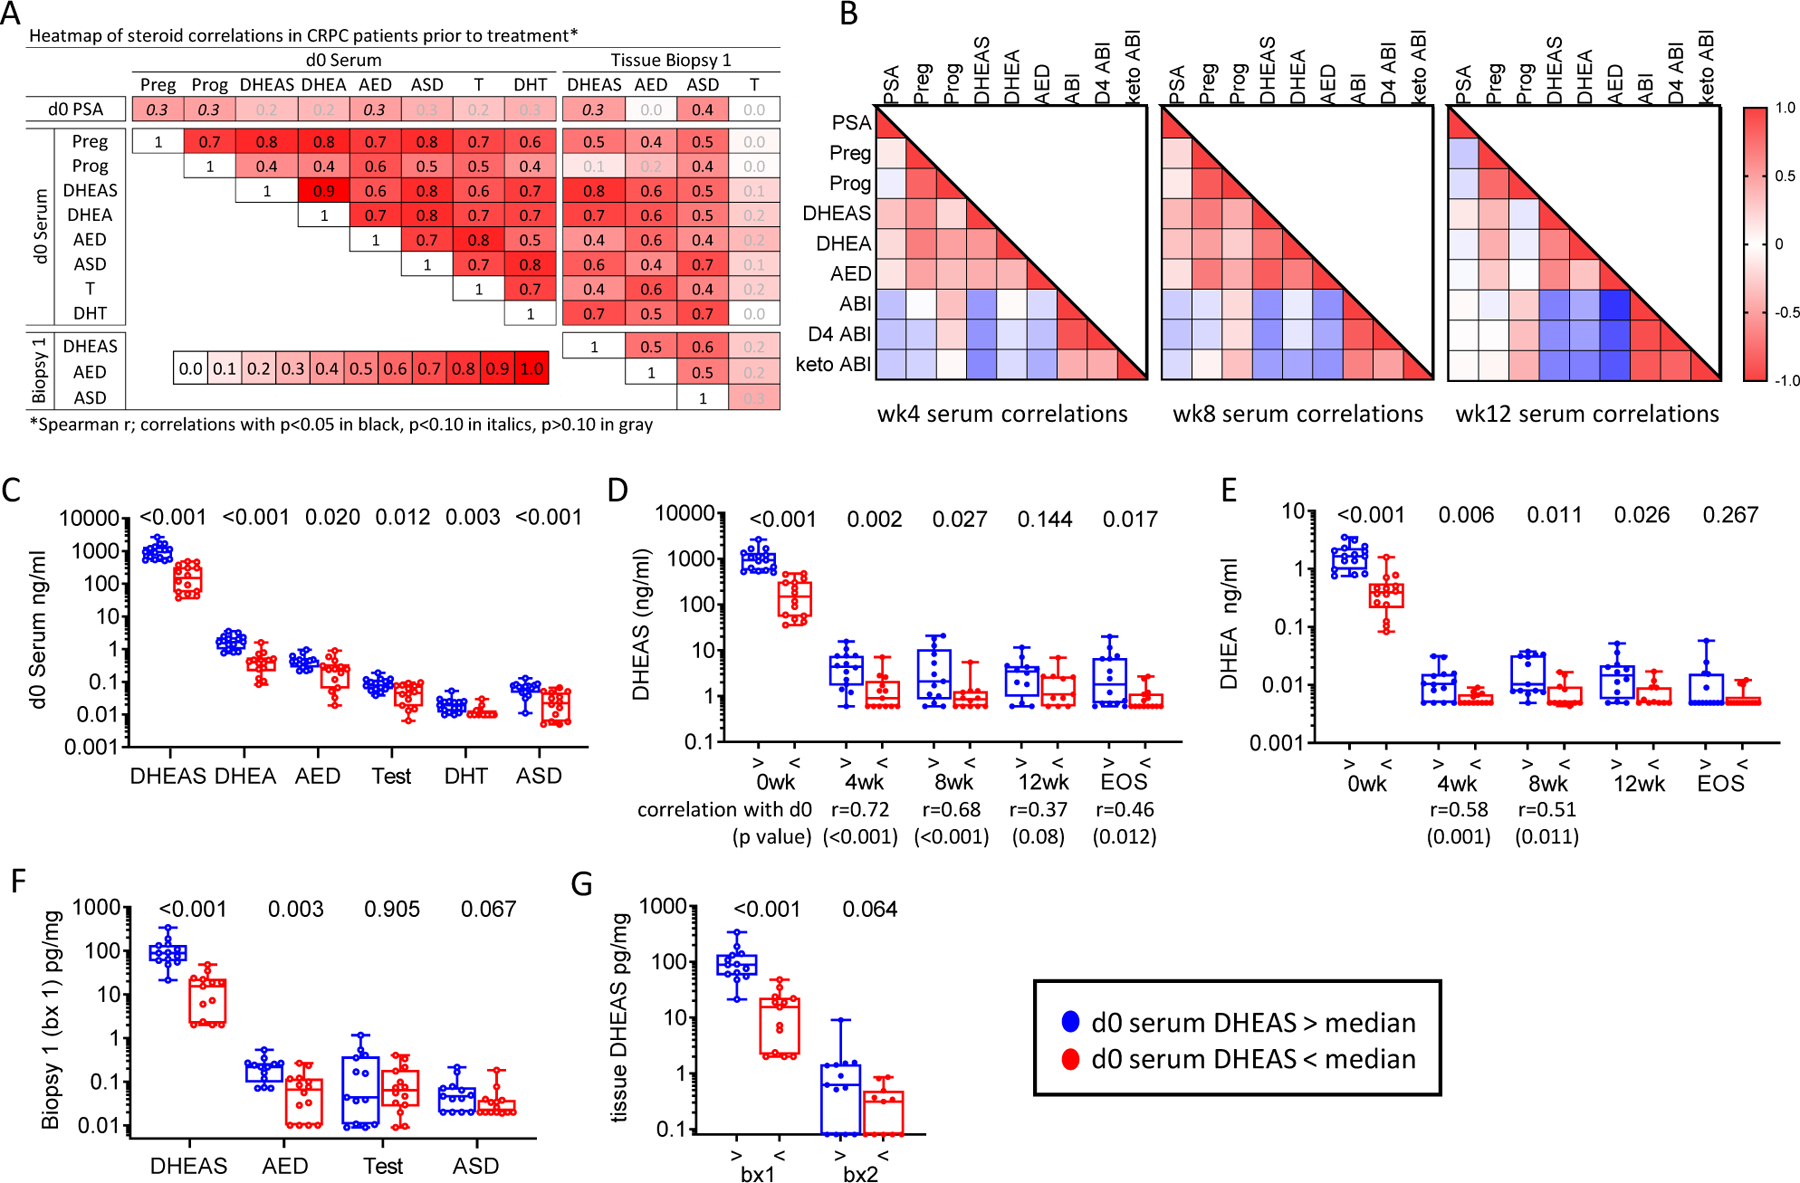
A. Heatmap of steroid correlations in pre-treatment serum (day 0) and metastatic tissue biopsies (Biopsy 1). The Spearman r value for each correlation is shown in the box. Correlations with p<0.05 in black, p<0.10 in italics, p>0.10 in gray. B. Heatmap of Spearman correlations for steroids in serum at week 4 (wk4), week 8 (wk8), and week 12 (wk12). C. Comparison of baseline serum steroid levels stratified by serum DHEAS levels above (blue) vs below (red) the median at baseline (d0). D. Comparison of DHEAS levels and E. DHEA levels in serum stratified by baseline serum DHEAS levels at baseline (0 weeks), at 4, 8 and 12 weeks (4wk, 8wk, 12wk) and at end of study (EOS). Significant Spearmen correlations between on-treatment and baseline values at each time point is indicated below the timepoint. F. Comparison of steroid levels in pre-treatment tissue biopsies (bx 1) stratified by serum DHEAS levels above (blue) vs below (red) the median at baseline. G. Comparison of tissue (tx) DHEAS levels stratified by baseline serum DHEAS levels in pre-treatment and on-treatment tissue biopsies (bx1 and bx2). P values for the indicated comparison calculated via non-parametric Mann Whitney t tests. Pregnenolone (Preg), progesterone (Prog), dehydroepiandrosterone sulfate (DHEAS), dehydroepiandrosterone (DHEA), androstenedione (AED), testosterone (test), dihydrotestosterone (DHT), androsterone (ASD), abiraterone (ABI), D4 abiraterone (D4 Abi), 3-keto-5a-abiraterone (Keto ABI).