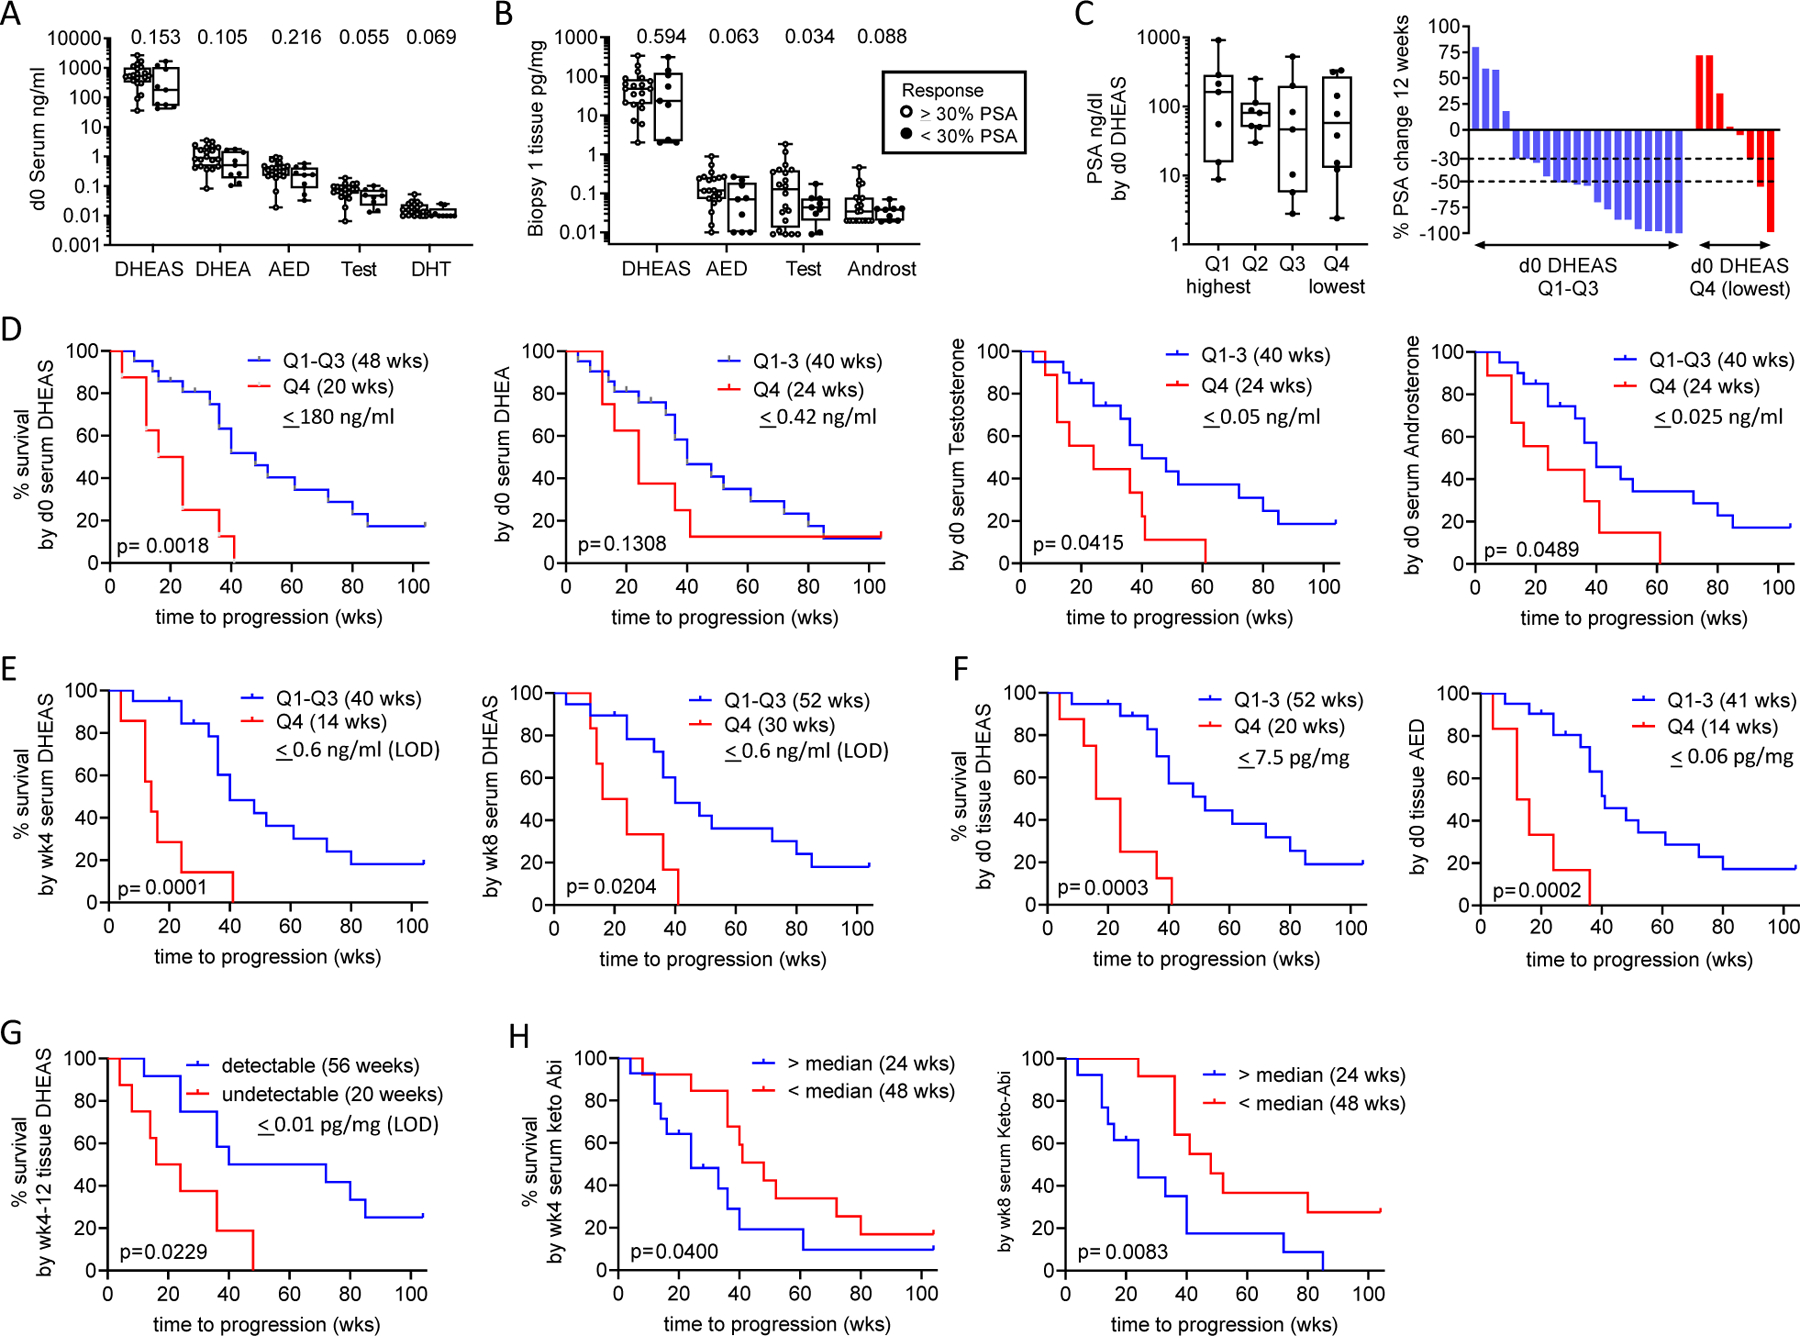
Figure 4. Association of Steroid and Abiraterone Levels with PSA Decline and Radiographic Progression on Abiraterone Acetate plus Prednisone.

Comparison of steroid levels in A. serum and B. metastatic tissue biopsies, based on achieving a 30% percent PSA decline at 12 weeks. C. Distribution of pre-treatment PSA levels and waterfall plot showing percent change in PSA at 12-weeks by quartile (Q1-Q4) of pre-treatment serum DHEAS levels. P values for the indicated comparison calculated via non-parametric Wilcoxon rank sum test (Mann Whitney test). D. Radiographic progression free survival (rPFS) as a function of baseline serum androgen levels comparing subjects in the lowest vs highest three quartiles (Q4 vs Q1–3). E. rPFS as a function of on-treatment serum DHEAS levels at week 4 (wk4) and week 8 (wk8) comparing subjects in the lowest vs highest three quartiles (Q4 vs Q1–3). F. rPFS as a function of pre-treatment tissue DHEAS and AED levels comparing subjects in the lowest vs highest three quartiles (Q4 vs Q1–3). In each case, the cut-off value reflects the highest number of the bottom 1/4th of the values. The quartiles were separately assessed in the pre and on-treatment populations. G. rPFS comparing subjects with detectable vs undetectable levels of DHEAS in tissue biopsies taken at 4 and 12 weeks of therapy. H. rPFS as a function of serum 3-keto-5a-abiraterone levels (keto-Abi) at week 4 (wk4) and week 8 (wk8) comparing subjects above vs below the median. Progression-free survival was estimated using Kaplan-Meier methods and compared using the Gehan-Wilcoxan test. Dehydroepi-androsterone sulfate (DHEAS), dehydroepiandrosterone (DHEA), androstenedione (AED), testosterone (test), dihydrotestosterone (DHT), androsterone (androst), quartile (Q).
