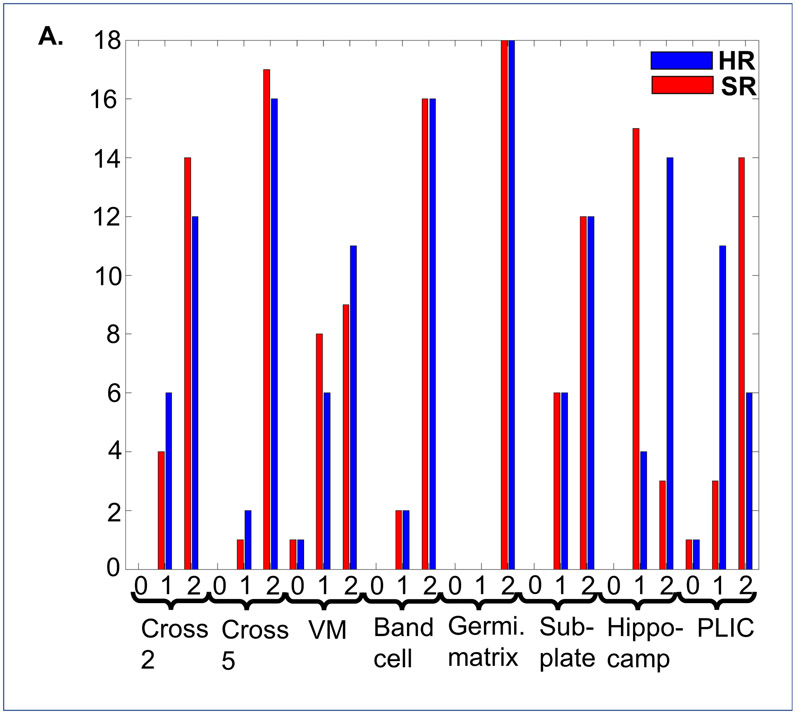
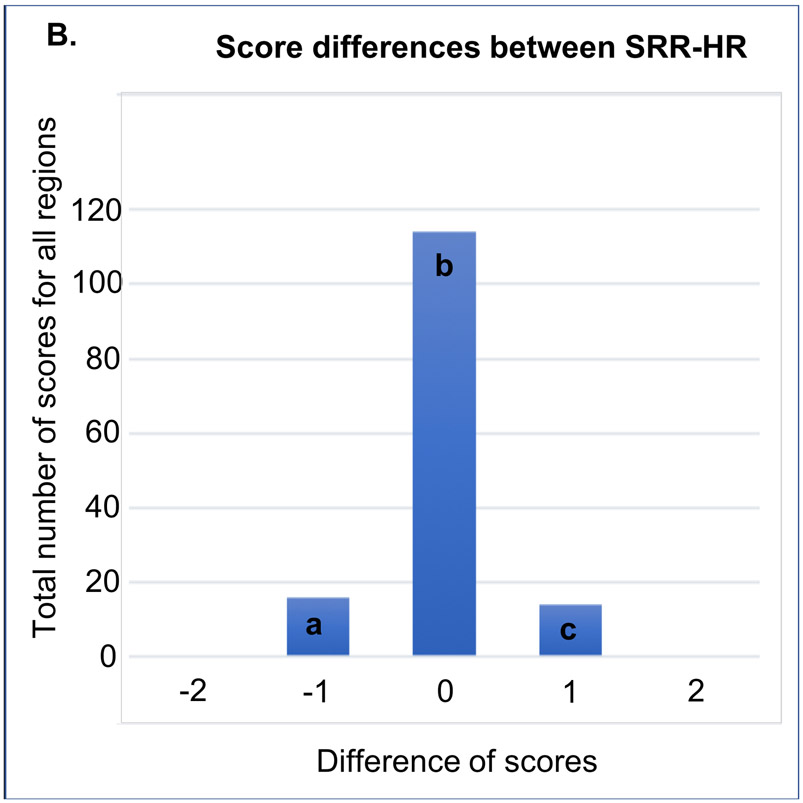
Figure 7.
(A.) shows the visibility scores (0 not visible, 1 visible with limitation, 2 is well visible) of the fine structures in super resolution reconstructed (SRR, labeled in red) and high resolution (HR, labeled in blue) images of each neonate (18 subjects, 8 structures) and (B.) shows the paired differences of the scores between SRR and HR images (SRR-HR, all regions included). Hippocampus for instance is better visible in HR whereas PLIC is better visible in SRR images. These differences correspond to bar a and c, respectively. (VM: von Monakow II, PLIC: Posterior limb of the internal capsule)


