
FIGURE 10.
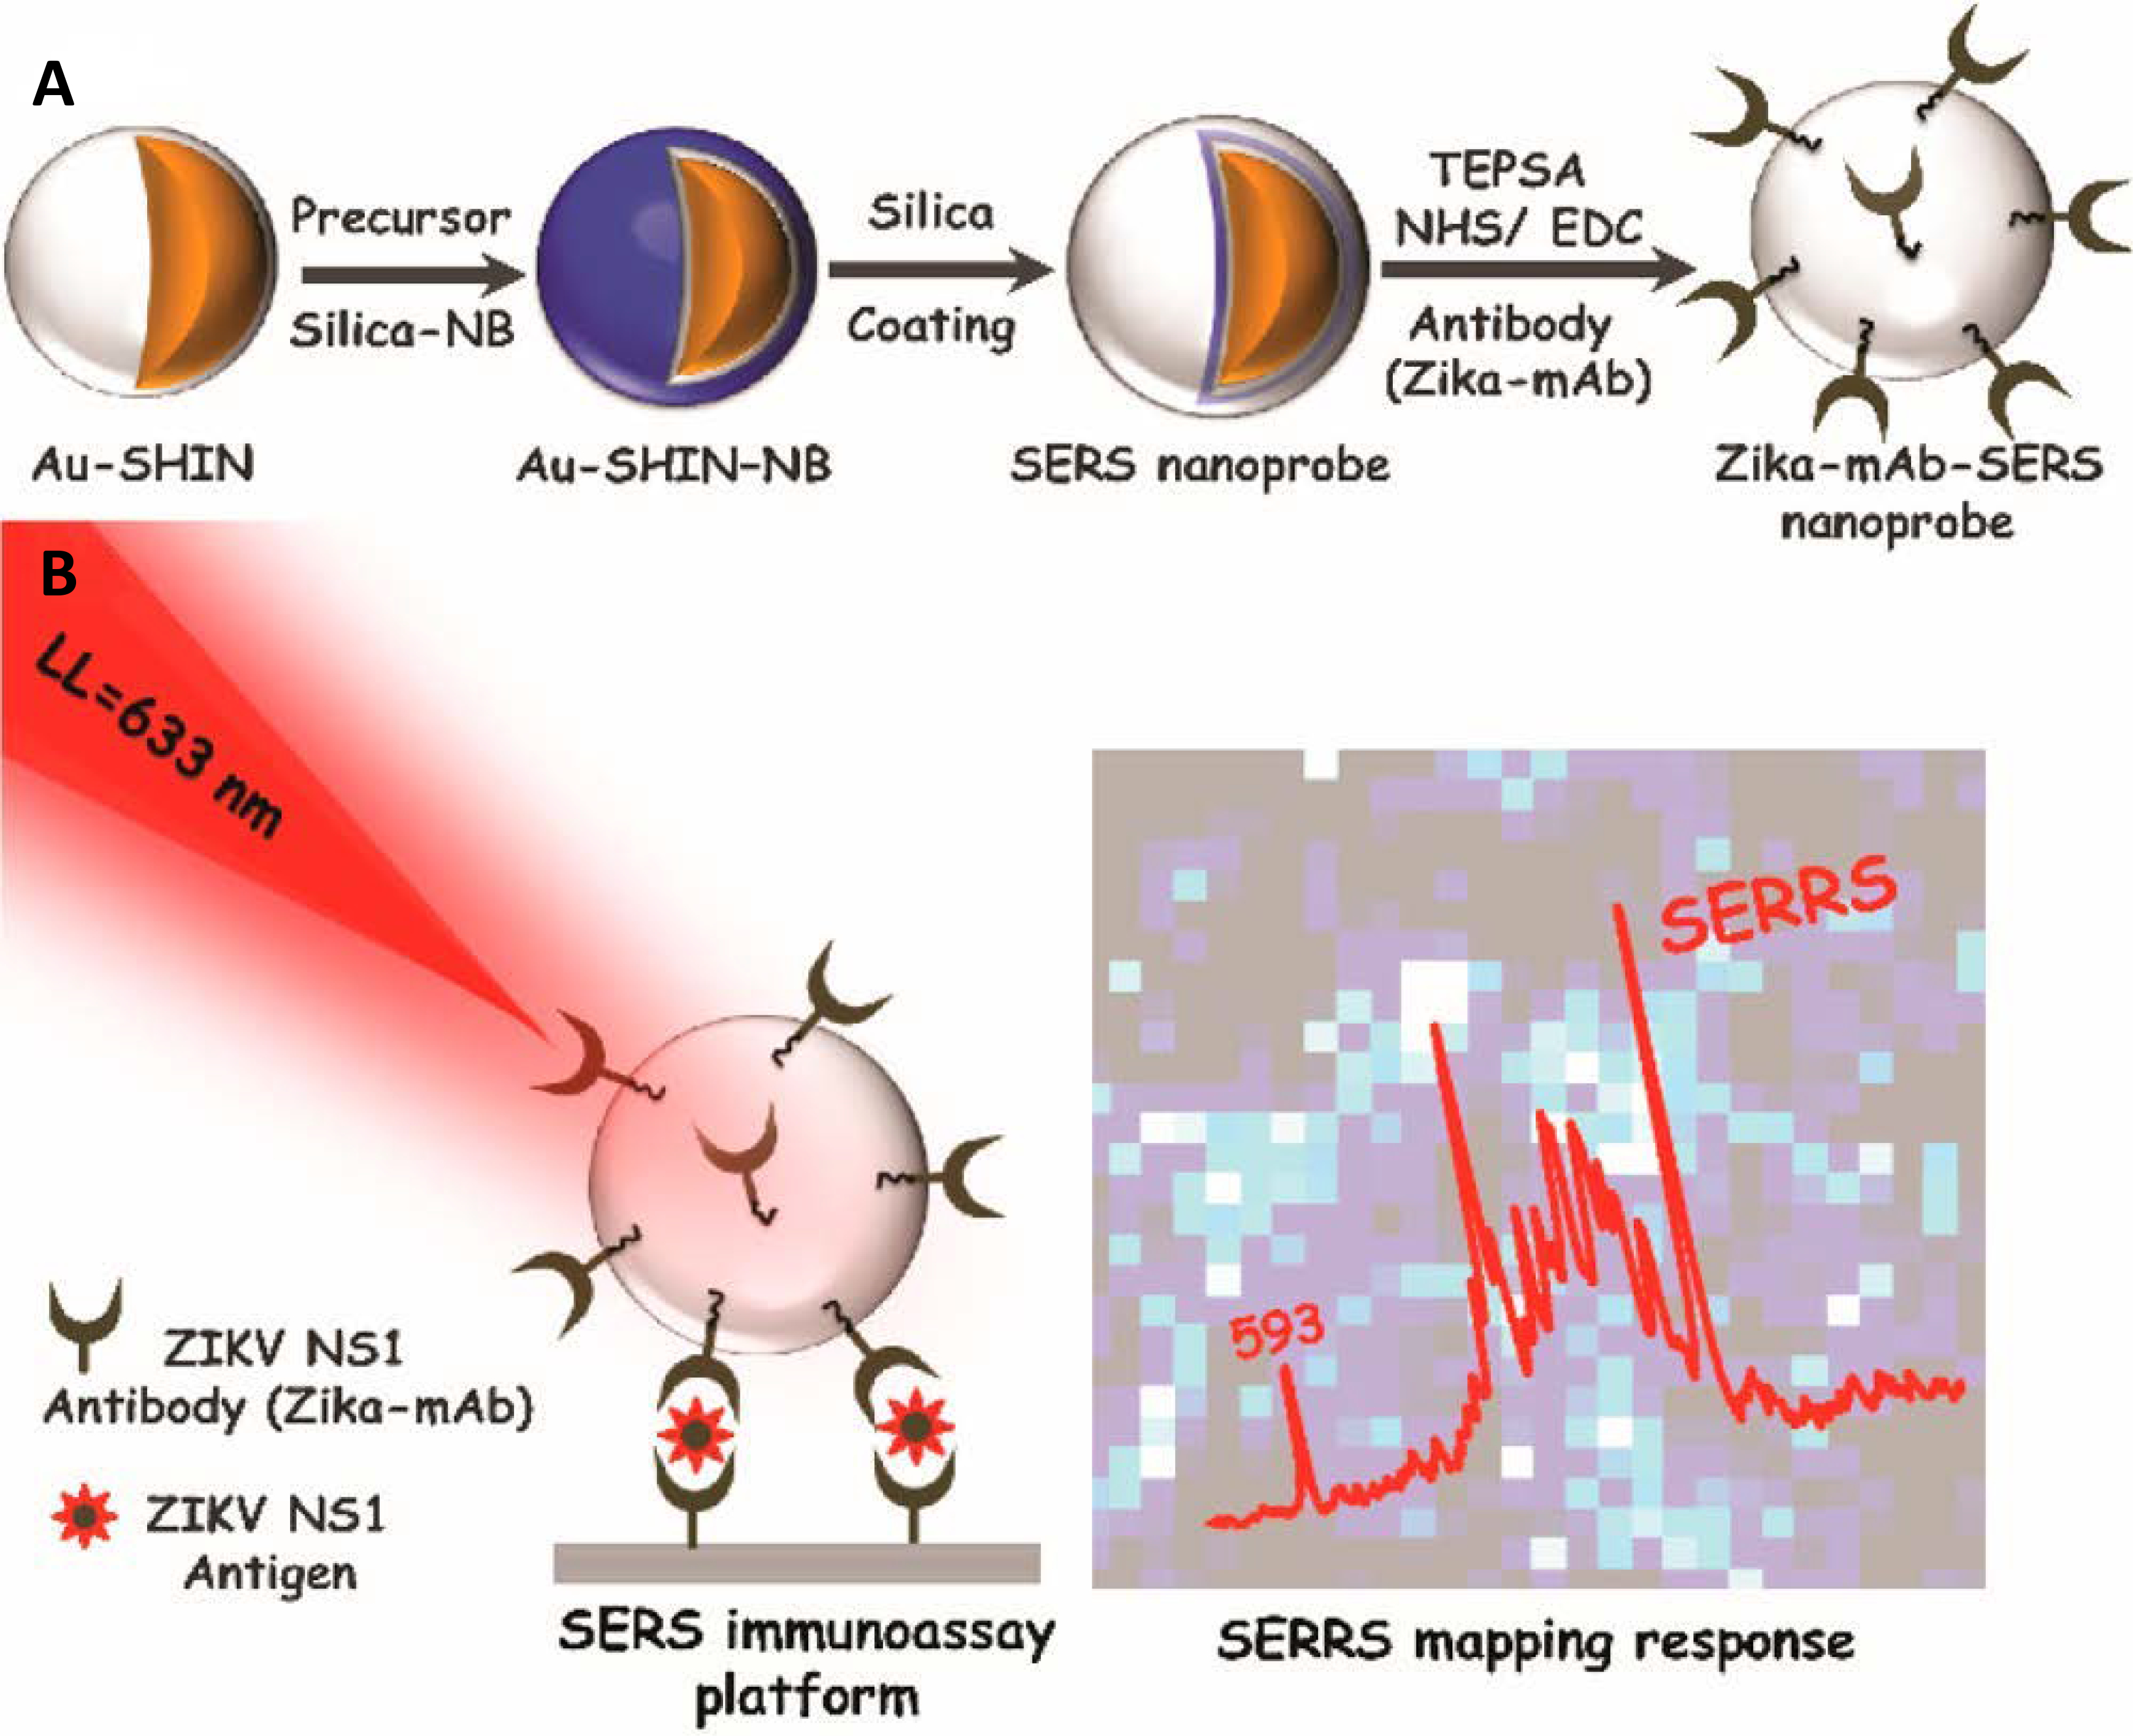
Schematic illustration of (a) Zika-mAb-SERS nanoprobe assembly: Au-SHIN (∼100 nm Au core + 4 nm silica shell thickness); Au-SHIN + NB Raman reporter layer; Au-SHIN + NB Raman reporter layer + final ∼10 nm silica shell (SERS nanoprobe); conjugation onto Zika NS1 monoclonal antibodies (Zika-mAb). (b) SERS immunoassay platform for detecting different concentrations of Zika NS1. The platform is irradiated with a 633 nm laser line and the SERRS signal from NB molecules, located in close proximity to gold nanoparticles (∼4 nm), is recorded by area mapping. Brighter spots indicate the higher intensity of the NB band at 593 cm−1. Reprinted with permission from ref (Camacho et al., 2018). American Chemical Society.