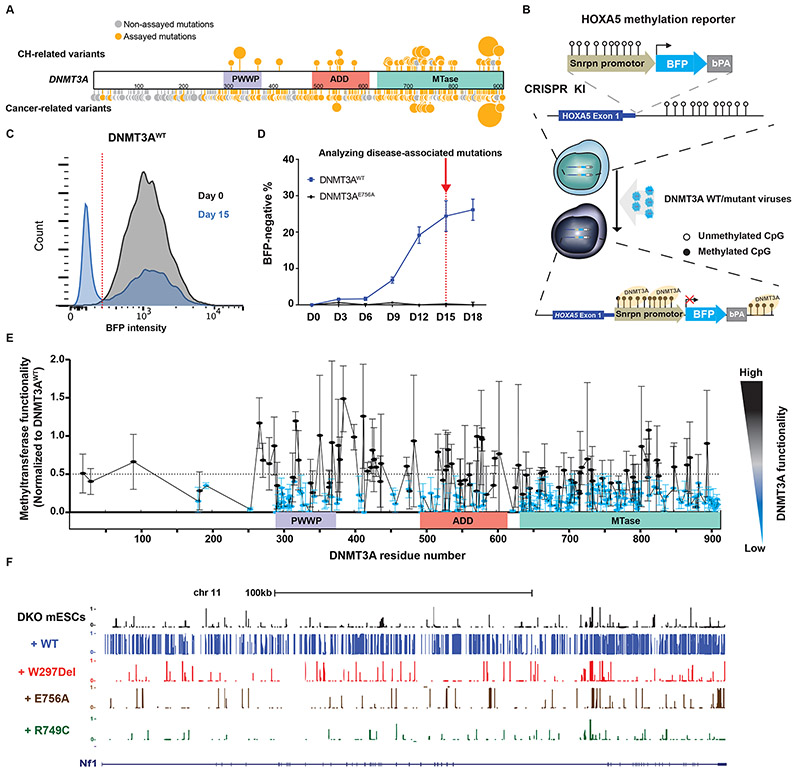
Figure 1: Methyltransferase activity analysis in 253 disease-associated DNMT3A missense mutations using the HOXA5-Snrpn-BFP methylation reporter.
(A) Schematic of missense mutations across DNMT3A in cancer, CH, and TBRS. Sites marked in orange represent tested mutations (Supplemental Table 1); the larger circles indicate recurrent mutations. Sites in grey represent mutations seen in the databases but not assayed here. (B) Schematic of the methyltransferase activity assay using HOXA5-Snrpn-BFP methylation reporter. The Snrpn promoter region was linked to BFP and a bovine polyA signal and knocked in to the HOXA5 locus in reverse orientation in HEK293T cells. These cells have high BFP fluorescence as shown in (C) in grey. When WT DNMT3A is introduced using lentiviral transduction, the methylation-sensitive HOXA5 regions promotes DNA methylation, which leads to suppression of BFP expression (blue plot in (C)). (C) Methyltransferase activity assay. The graph depicts blue fluorescence intensity in the DNMT3AWT-transduced cells as measured by flow cytometry on day 0 (grey) and day 15 (blue). (D) The panel represents the percent of BFP-negative cells after transduction with DNMT3AWT or DNMT3AE756A constructs measured by flow cytometry over 18 days. (E) Methyltransferase activity assay of 253 disease-associated DNMT3A missense mutations measured by flow cytometry. Lentiviral particles of each DNMT3A variant were infected in three biological replicates in HOXA5-Snrpn-BFP reporter cells. Activity was normalized to the percent BFP-negative % cells in DNMT3AWT-transduced cells 15 days later. To visualize results, we defined and colored mutations based on their levels of methyltransferase activity. Methyltransferase activity of those mutations labeled in were classified as having impaired methyltransferase activity (activity < 0.5), while those in black was considered to be in the range of WT DNMT3A (activity > 0.5). Data are presented as mean ± s.e.m. (F) DNA methylation profile (WGBS) of cells transduced with the indicated DNMT3A mutants displayed on the UCSC genome browser. See also supplemental Figures 1-3.

