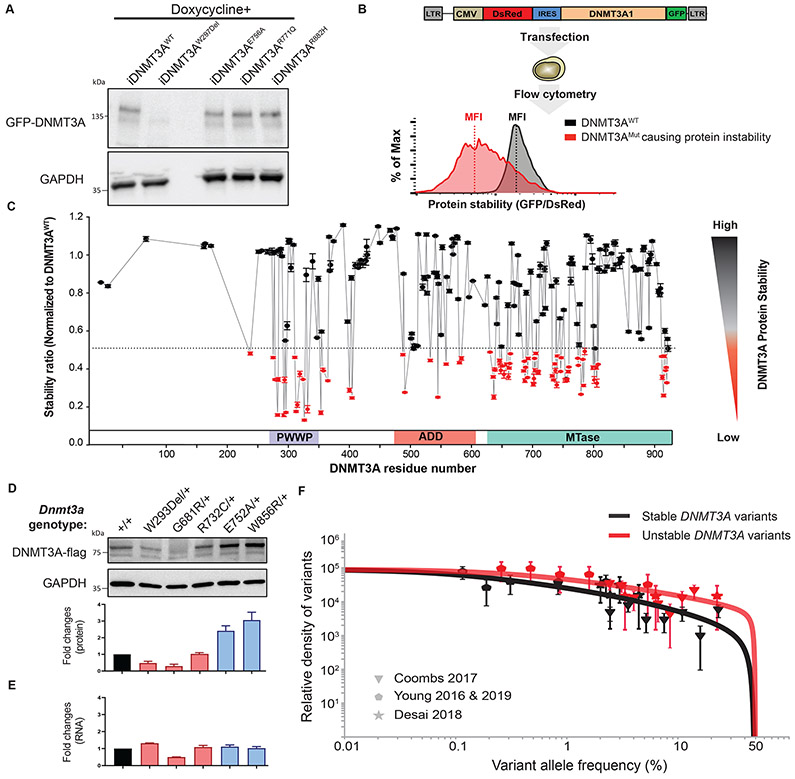
Figure 2: More than a third of missense mutations across DNMT3A decrease protein stability.
(A) Western blot analysis of GFP-DNMT3A fusion protein and GAPDH control expression measured in DKO ESCs after doxycycline induction. (B) Schematic of protein stability assay using the DsRed-IRES-DNMT3A-GFP bicistronic vector. The vector produces a DNMT3A-GFP fusion protein, such that the level of GFP fluorescence allows inference of the amount of DNMT3A protein present. The fusion protein transcript is downstream of DsRed, following an internal ribosome entry site (IRES) so that DsRed serves as an internal control for differences in transcription efficiencies of the constructs. The construct is transfected into the HEK293T cells and 48 hours later, green and red fluorescence is measured by flow cytometry (right panel). The ratio of the mean fluorescence intensity (MFI) of the green and red fluorescence is used to indicate the level of GFP-tagged DNMTA protein in the cells. The fluorescence ratios in cells transfected with DNMT3A-mutant constructs is normalized to that of the DNMT3A-WT-expressing constructs. (C) The graph depicts protein stability of 253 DNMT3A missense mutations measured as described in (B). To visualize results, we defined and colored mutations based on their levels of severity of impaired protein stability. Mutations marked in red indicate those with severely impaired protein stability (Stability ratio < 0.5), whereas those in black was considered to be comparable to DNMT3AWT (Stability ratio > 0.5). The mutation labeled in red is one identified above as unstable. Data are presented as mean ± s.e.m. (D) Western blotting analysis and quantification of heterozygous mESC unstable mutants (DNMT3AW293Del, DNMT3AG681R, DNMT3AR732C) and stable mutants (DNMT3AE752A DNMT3AW856R) normalized to GAPDH. (E) Quantification of RNA expression levels in mESC mutants described in (D) normalized to GAPDH. (F) The distribution of variant allele frequencies of stable (grey data points) and unstable (red data points) variants plotted after controlling for study size, panel size and mutation rate compared to maximum-likelihood VAF distributions (red and grey lines) that assume a parameterized form for the distribution of fitness effects (29).

