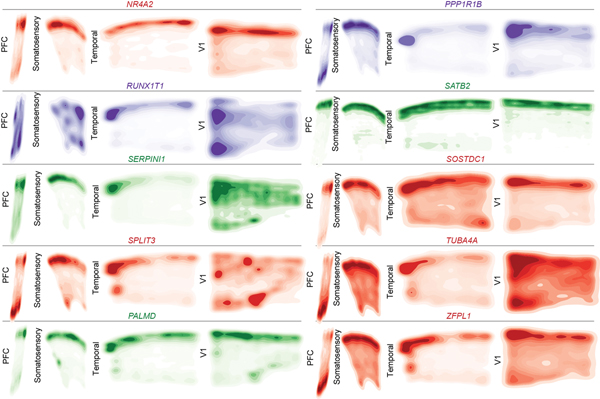
Extended Data Figure 9. Spatial Expression Patterns of Cell Type and Neuronal Cluster Marker Genes GW20 Part 2.
Kernel density plots of each gene assayed using spatial RNA in situ analysis. Plots are made from all spots, and are shown across all four sampled cortical areas of a GW20 individual. Color is for emphasis of expression, but individual colors have no specific meaning.

