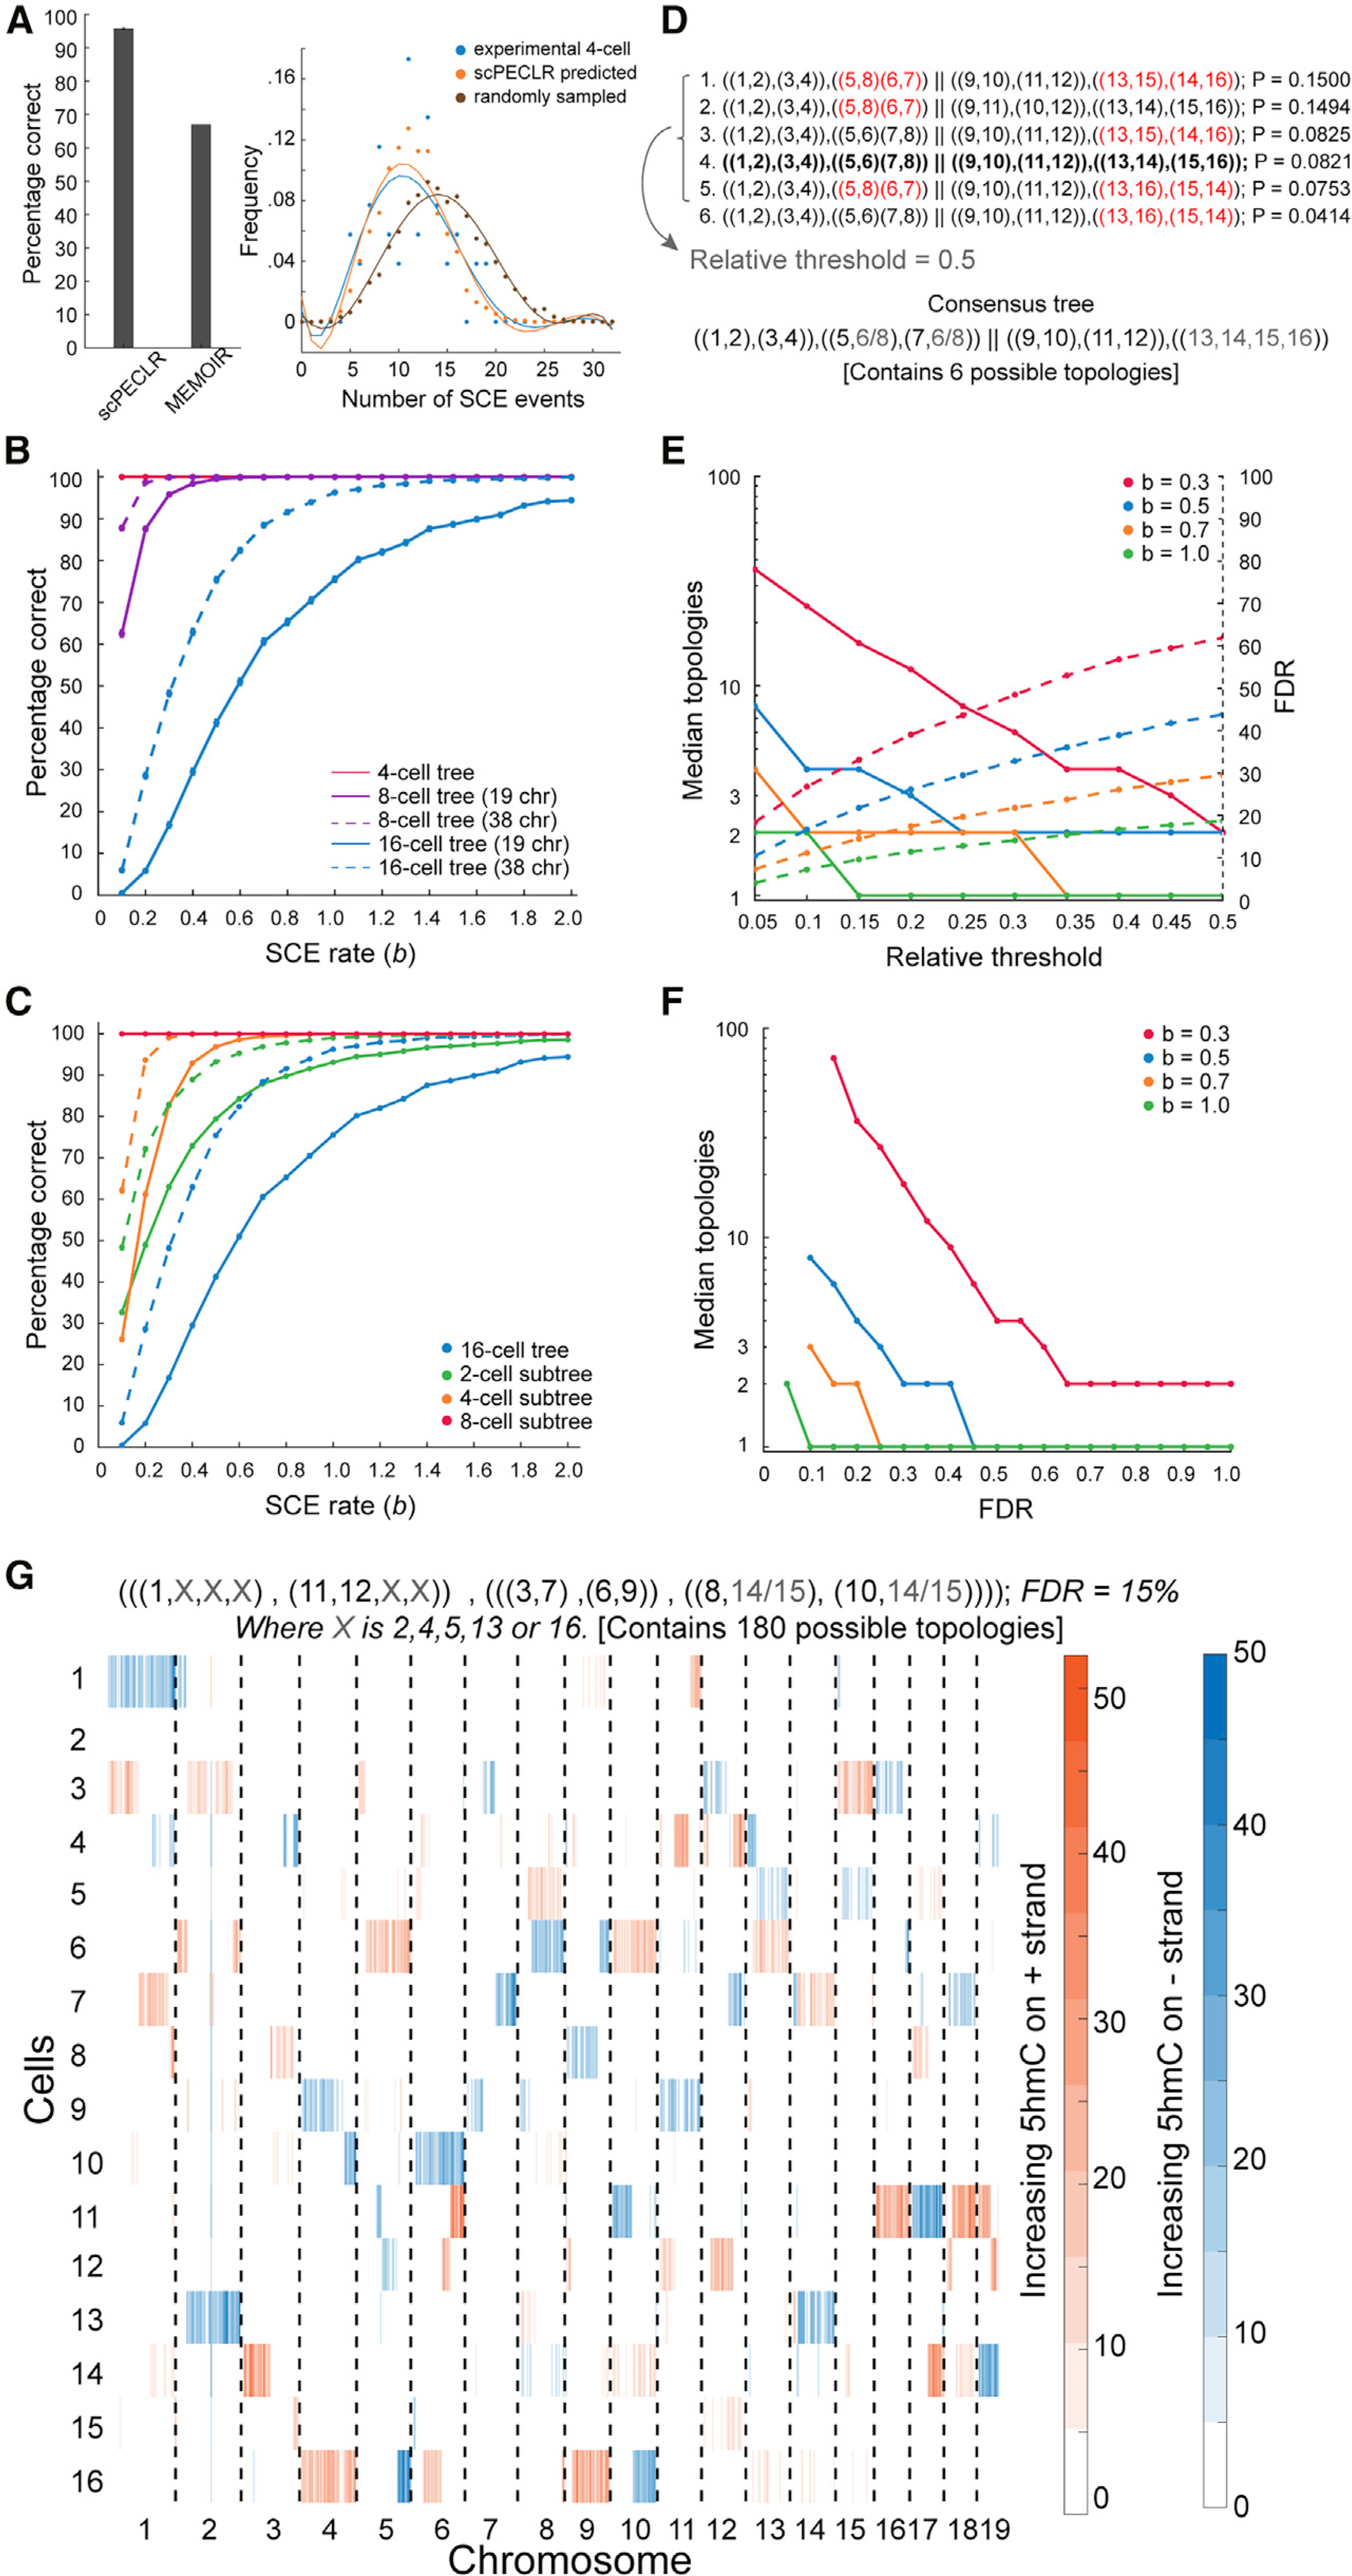
Figure 3. scPECLR can reconstruct 8- and 16-cell lineage trees.

(A) (Left) scPECLR accurately predicts the lineage of 96% of simulated 8-cell trees (b = 0.3). Error bars indicate the bootstrapped standard error. In comparison, MEMOIR accurately predicts 67% of the top 40% most reliably reconstructed 8-cell trees (Frieda et al., 2017). (Right) The distribution of SCE events in 4-cell embryos (blue) is not statistically different from that of 4-cell trees inferred with scPECLR starting from 8-cell trees (orange, p > 0.8), but is different from 4-cell trees inferred from a random topology at the 8-cell stage (brown, p<10−4).
(B) Percentage of simulated 8- and 16-cell trees that are correctly predicted by scPECLR for different SCE rates (b). The prediction accuracy is computed by simulating 5,000 trees. Error bars indicate the bootstrapped standard error.
(C) Percentage of 2-, 4-, and 8-cell subtrees that are accurately predicted within simulated 16-cell trees as a function of the SCE rate (b). The prediction accuracy is computed by simulating 5,000 16-cell trees. Error bars indicate the bootstrapped standard error.
(D) Construction of consensus trees. In this example, the top six tree topologies (with the highest probabilities) obtained after applying scPECLR on a 16-cell tree are shown. The relative threshold (RT) parameter is used to determine the number of topologies considered in the consensus tree analysis. With an RT of 0.5, the top 5 topologies are selected to generate a consensus tree that is consistent with all these trees. The uncertainty within the consensus tree is quantified by the number of tree topologies it contains. Red fonts indicate parts of the lineage tree that are incorrectly predicted. The tree highlighted in bold is the true tree.
(E) Simulations show that as the RT increases, the median number of topologies in the consensus tree decreases (solid lines, left axis) whereas the false discovery rate (FDR) increases (dotted lines, right axis). In these simulations, two other parameters t8 and t4 are set to 0.75 and 1.0, respectively. For details, see STAR Methods.
(F) Graph showing how the specificity of the consensus tree is related to error tolerance. As the FDR decreases, the median number of topologies contained within the consensus tree increases. Note that the lowest FDR possible for b = 0.3, 0.5, 0.7, and 1.0 are 15%, 10%, 10%, and 5%, respectively.
(G) Single-cell 5hmC sequencing data for a 16-cell mouse embryo (4-Mb bins). The consensus tree associated with this embryo is estimated to have a 15% FDR rate. RT, t8, and t4 are set at 0.05, 0.85, and 0.8, respectively. The consensus tree is constrained to only 180 possible topologies, a significant reduction from the more than 600 million trees originally.
