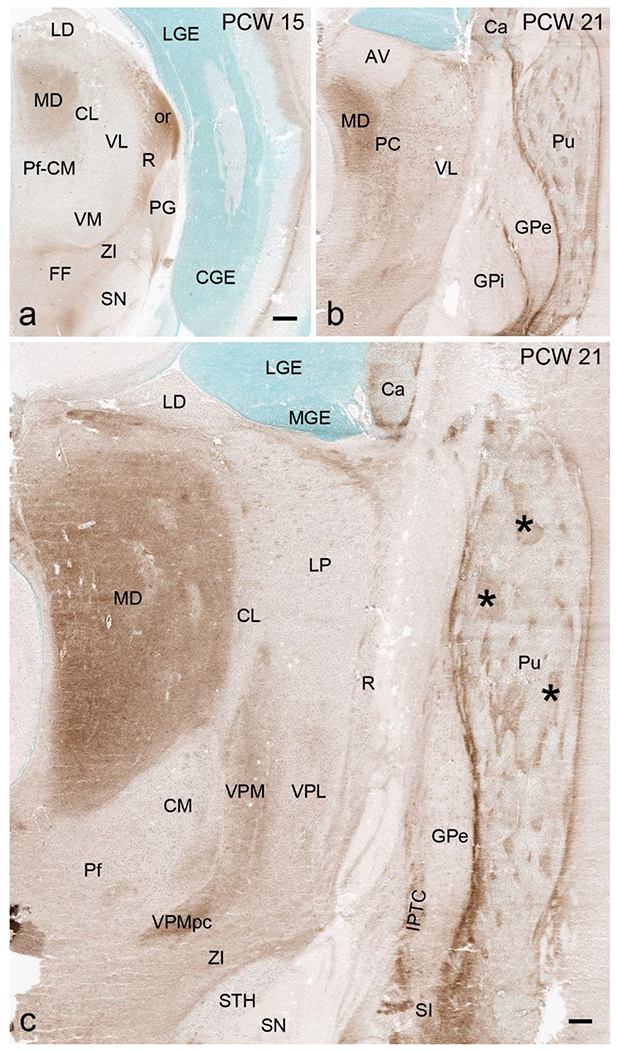
Fig. 16.

AChE staining patterns in the thalamus and basal ganglia. (a) AChE staining showing its enriched expression in the mediodorsal thalamic nucleus (MD) and some fiber regions such as optic radiation (or) at PCW 15. (b,c) AChE staining showing its enriched expression in the MD and two subdivisions of ventroposterior medial nucleus (VPM and VPMpc) as well as in the patches (*) of the putamen (Pu), substantia innominata (SI) and some fiber regions such as inter-pallidal transient cell zone (IPTC). Scale bars: 800 μm in (a) for (a-b); 400 μm in (c).
