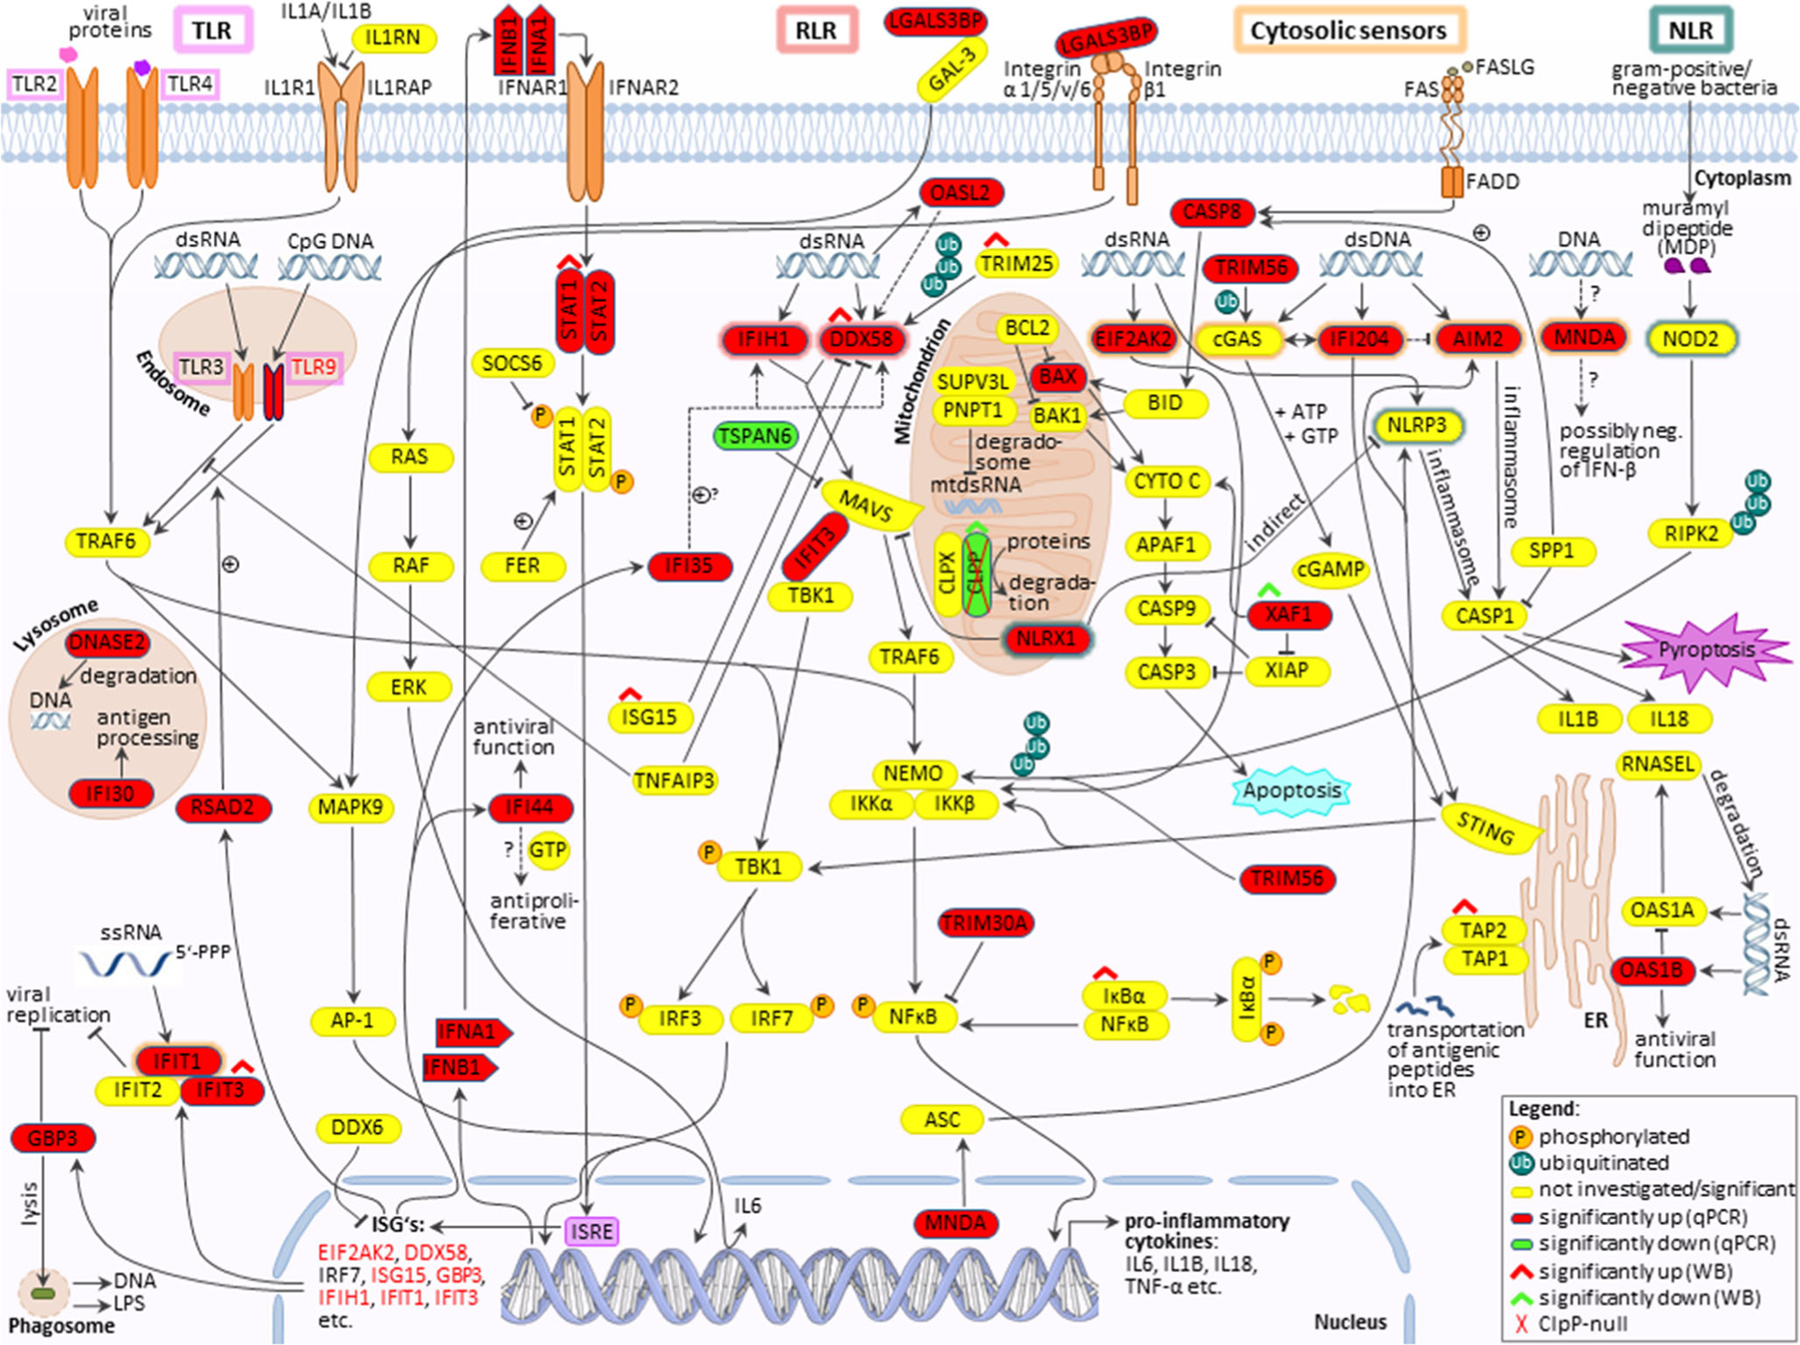
Fig. 7.

Schematic overview of innate immunity signaling, with an illustration of the results from this study. TLRs= outlined in pink; RLRs= outlined in red; cytosolic nucleic acid sensors= outlined in orange; NLRs= outlined in green. Significant RT-qPCR results are represented by highlighting the factors in red, green, or yellow (red= induced; green= reduced; yellow= not significant/investigated). Significantly altered protein expressions were marked with red or green roofs (red= increased; green= reduced). Dashed lines indicate discussed functions of corresponding factors. +, induction; P, phosphorylated; Ub, ubiquitinated; other symbols can be retrieved in the GeneCards database
