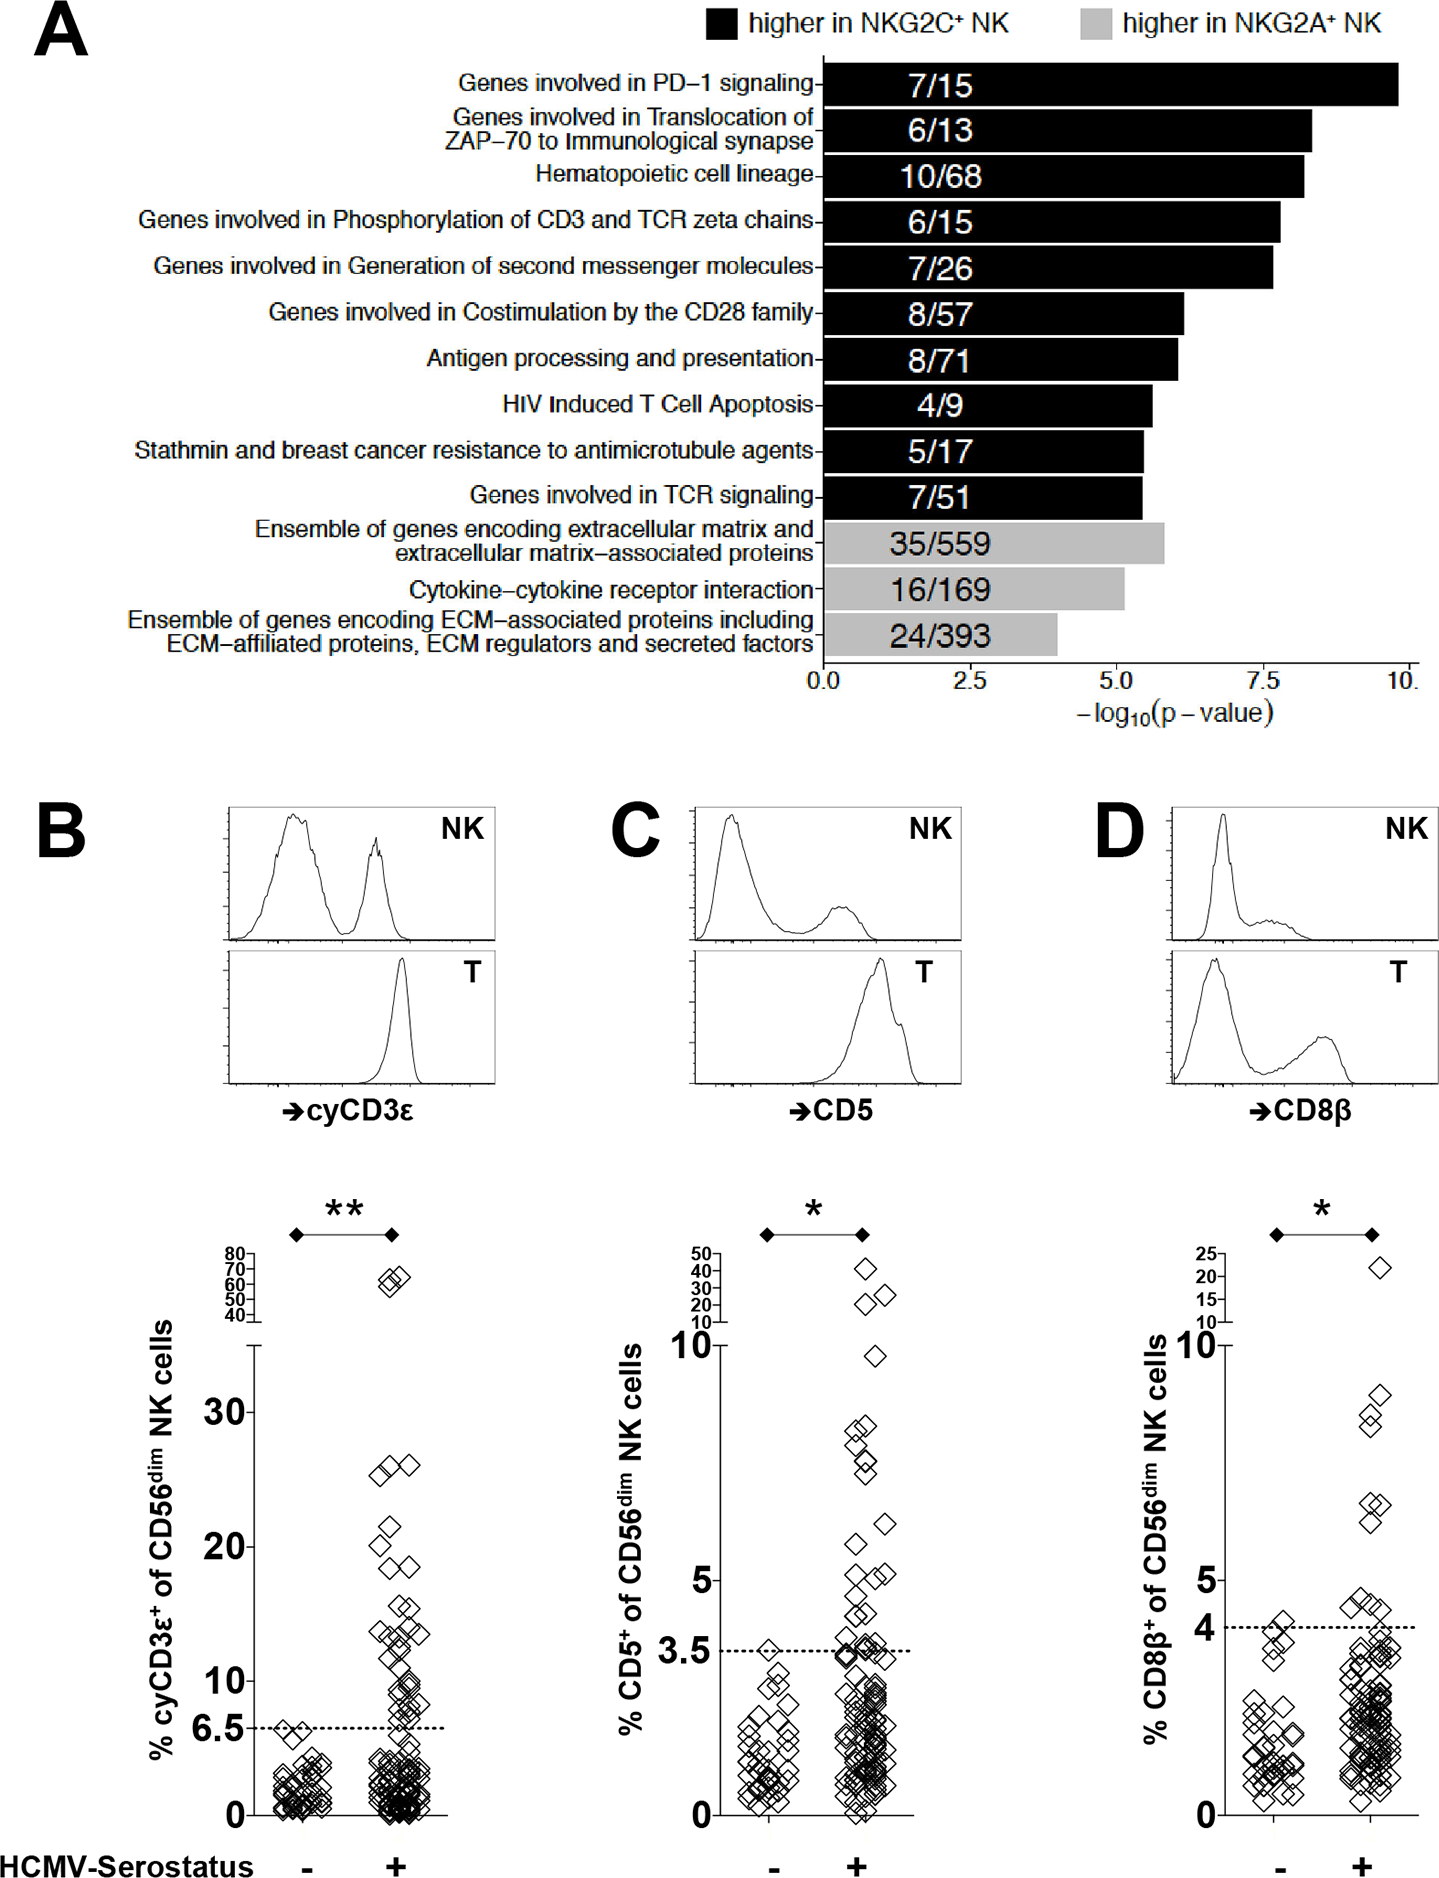
FIGURE 1.

Transcriptomic and epigenomic profiling identifies an enrichment of T cell related molecules among HCMV-induced NKG2C+ NK cells. (A) Bar plots display −log10 (p-value) of gene set enrichment in genes higher in NKG2C+ (black) or higher in NKG2A+ (gray) NK cells. Depicted are the top pathways enriched among genes associated with higher expression within NKG2C+ or NKG2A+ NK cells. Fractions within bar plots indicate the number of differentially expressed (DE) genes found within the total gene set. (B) Representative flow cytometry plots to identify cyCD3ε+ NK cells from healthy donors are shown. CyCD3ε+ NK cells were defined as viable surfaceCD3ε(UCHT1)−CD56dimcytoplasmicCD3ε(SK7)+ lymphocytes. Intracellular staining of cyCD3ε is shown for NK cells and T cells from the same donor. Frequency of cyCD3ε+ NK cells among CD56dim NK cells from healthy HCMV seronegative (n=48) and seropositive (n=105) donors are shown below. Surface expression on NK cells and autologous T cells for (C) CD5 and (D) CD8β are shown with frequencies of CD5+ or CD8β+ NK cells among CD56dim NK cells from healthy HCMV seronegative (n=40) and seropositive (n=96) donors displayed below. The dotted horizontal line indicates the 6.5% threshold defining an expanded cyCD3ε+ cell population.
