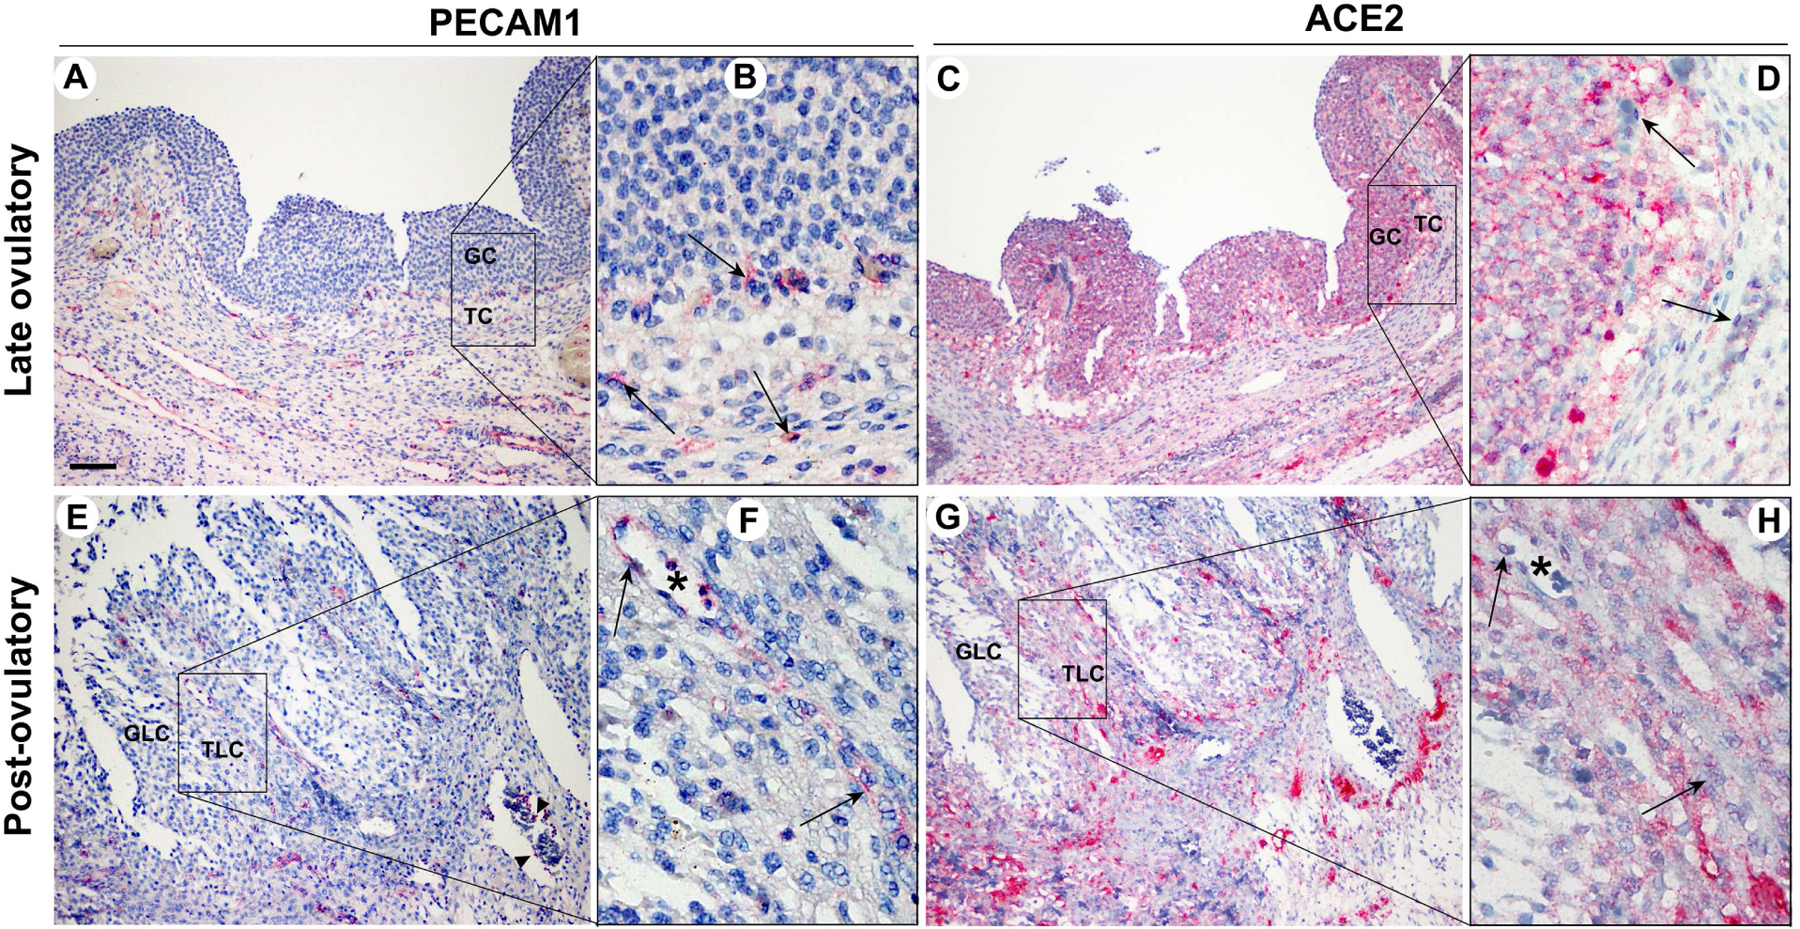
Figure 3. The comparison of the expression pattern between PECAM1 and ACE2 in late ovulatory and post-ovulatory follicles.

Dominant follicles were retrieved from the ovaries of women undergoing laparoscopic tubal sterilization. The serial sections of dominant follicles obtained during the late (A & B) and post (C & D) ovulatory phase were subjected to immunohistochemical analyses to detect PECAM1 and ACE2. Square bars in A, C, E, and G are amplified in B, D, F, and H, respectively. PECAM1 was used to detect endothelial cells; it also stained a subpopulation of leukocytes. Asterisks in F and H were used to locate the same structure in the serial section of the same post-ovulatory follicle. Pink/red staining indicates positive signals for PECAM1 and ACE2. All sections were lightly stained with hematoxylin (blue staining) for nuclear counterstaining. Arrows (B, D, F, H) and arrowheads (E) point to endothelia cells and leukocytes stained with PECAM1, respectively. GC, granulosa cells; TC, theca cells; GLC, granulosa lutein cells; TLC, theca lutein cells. Scale bar in A; 100 μm
