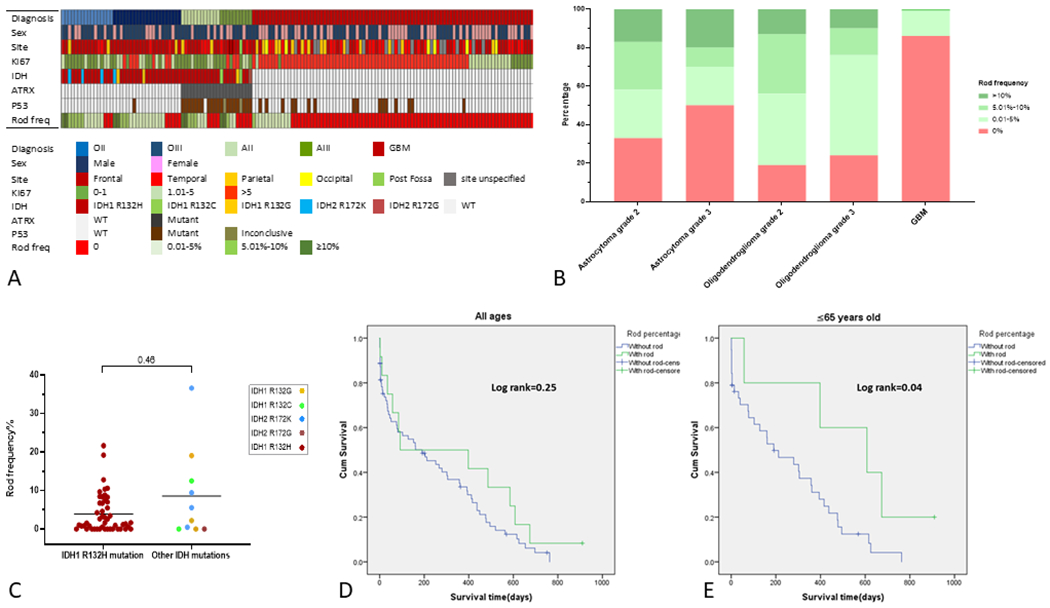
Figure 3:

A) Oncoprint summarizing demographic features, tumour localization, Ki67 proliferation index, IDH/ATRX/p53 mutation status, and rod frequency (freq) for our entire adult diffuse glioma co-hort. B) Bar graph showing the relative proportion of oligodendrogliomas, astrocytomas, and glioblastomas containing rods. Rod frequency is illustrated semi-quantitatively using 5% and 10% cut-offs into three categories represented by increasingly darker shades of green (pink=no rods). C) Dot plot comparing rod frequencies among gliomas with IDH1R132H mutations and those with IDH2 and non-canonical IDH1 mutations. D, E) Kaplan-Meier analyses comparing post-operative survival among subjects with rod-positive (green) versus rod-negative (blue) IDH wild-type glioblastomas. There was no significant difference in survival among subjects of all ages whereas those 65 years of age and younger with rods exhibited significantly improved survival (E).
