FIGURE 14.

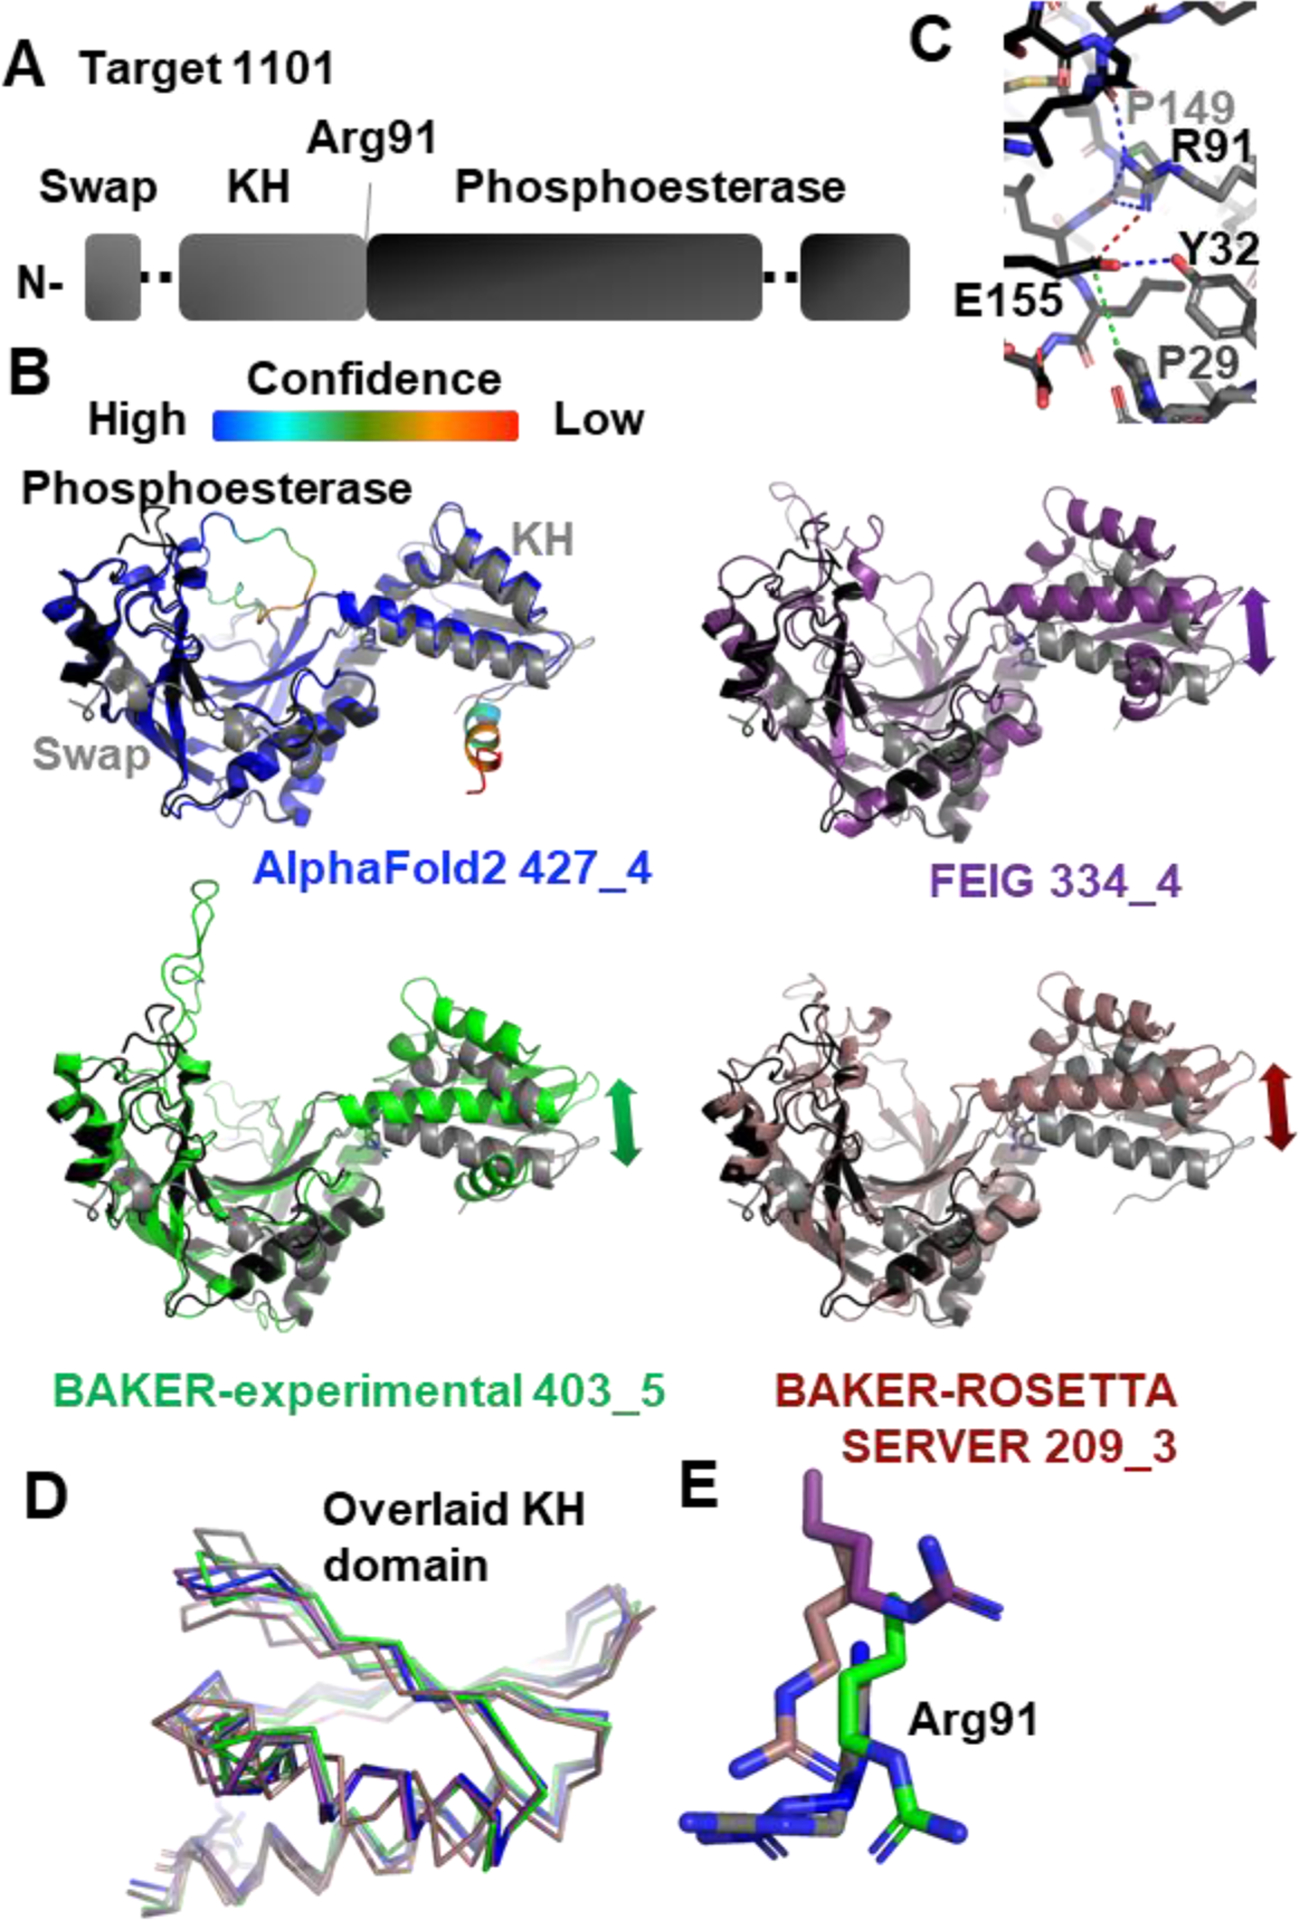
Target 1101 ASCC1. Numberings are based on prediction models with a difference from the protein by −40. A, Domain schematic shows sequence position of domain swap, KH domain, and phosphoesterase domain. B, ASCC1 shows KH and phospoesterase domain positioned side-by-side. Prediction models (color) were overlaid pairwise on the phosphesterase domain of the ASCC1 experimental crystal structure (colored as in A). The AlphaFold2 model was colored based on the confidence level of the prediction (given in color bar). Arrows indicate significant deviation in domain position. C, A zoomed view of the interface between the KH and phosphoesterase domain. Red, blue, green indicate cross-domain salt bridge, hydrogen bonding, and van der Waals, respectively. D, Overlay of KH domains with crystal structure. Color is same as in B. D, A zoomed view of Arg91, positioned at the center of the KH-phosphoesterase domain interface. Three of the four models positioned it accurately. Color is same as in B. E. A zoomed view of Arg91, positioned at the center of the KH-phosphoesterase domain interface. In three of the four models it was positioned accurately. Color is same as in B
