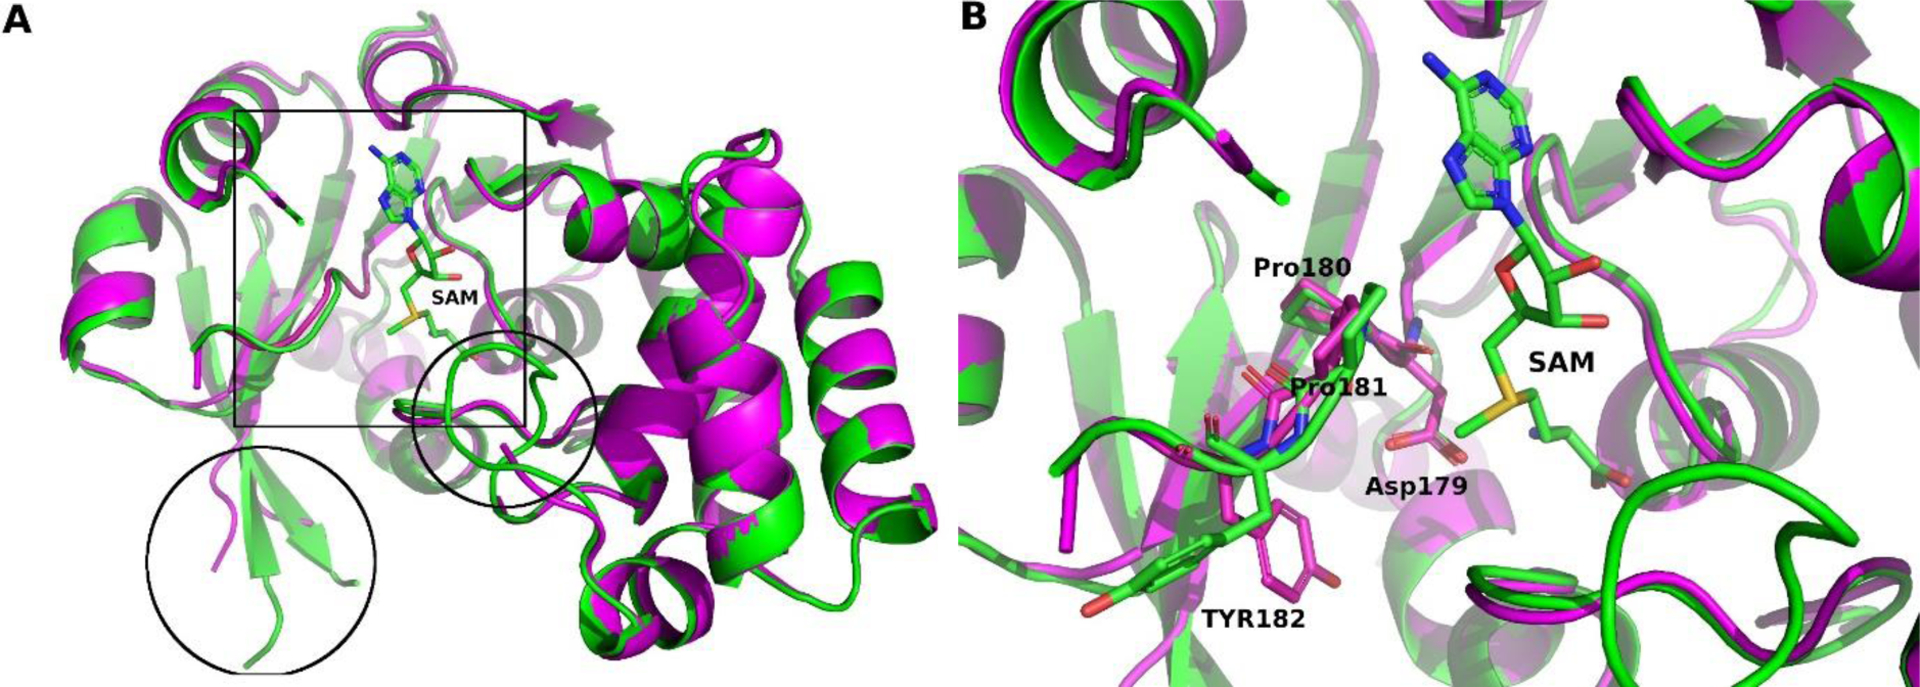
FIGURE 8.

Model T1057TS427 superimposed with M.CbeI. A, Overall view highlighting main differences (box: active site region and circles: regions with disorder/differences). B, Close up view of the active site showing the conserved DPPY motif and SAM in stick representation. M.CbeI is shown as a green ribbon and green carbon atoms when cartoon representation is used. Model T1057TS427 is shown in magenta. Blue nitrogen atoms, red oxygens and yellow sulfur atoms are used for both in stick representation. Figures were made using PyMol83–85 and GIMP 2.10.18 (http://gimp.org/).
