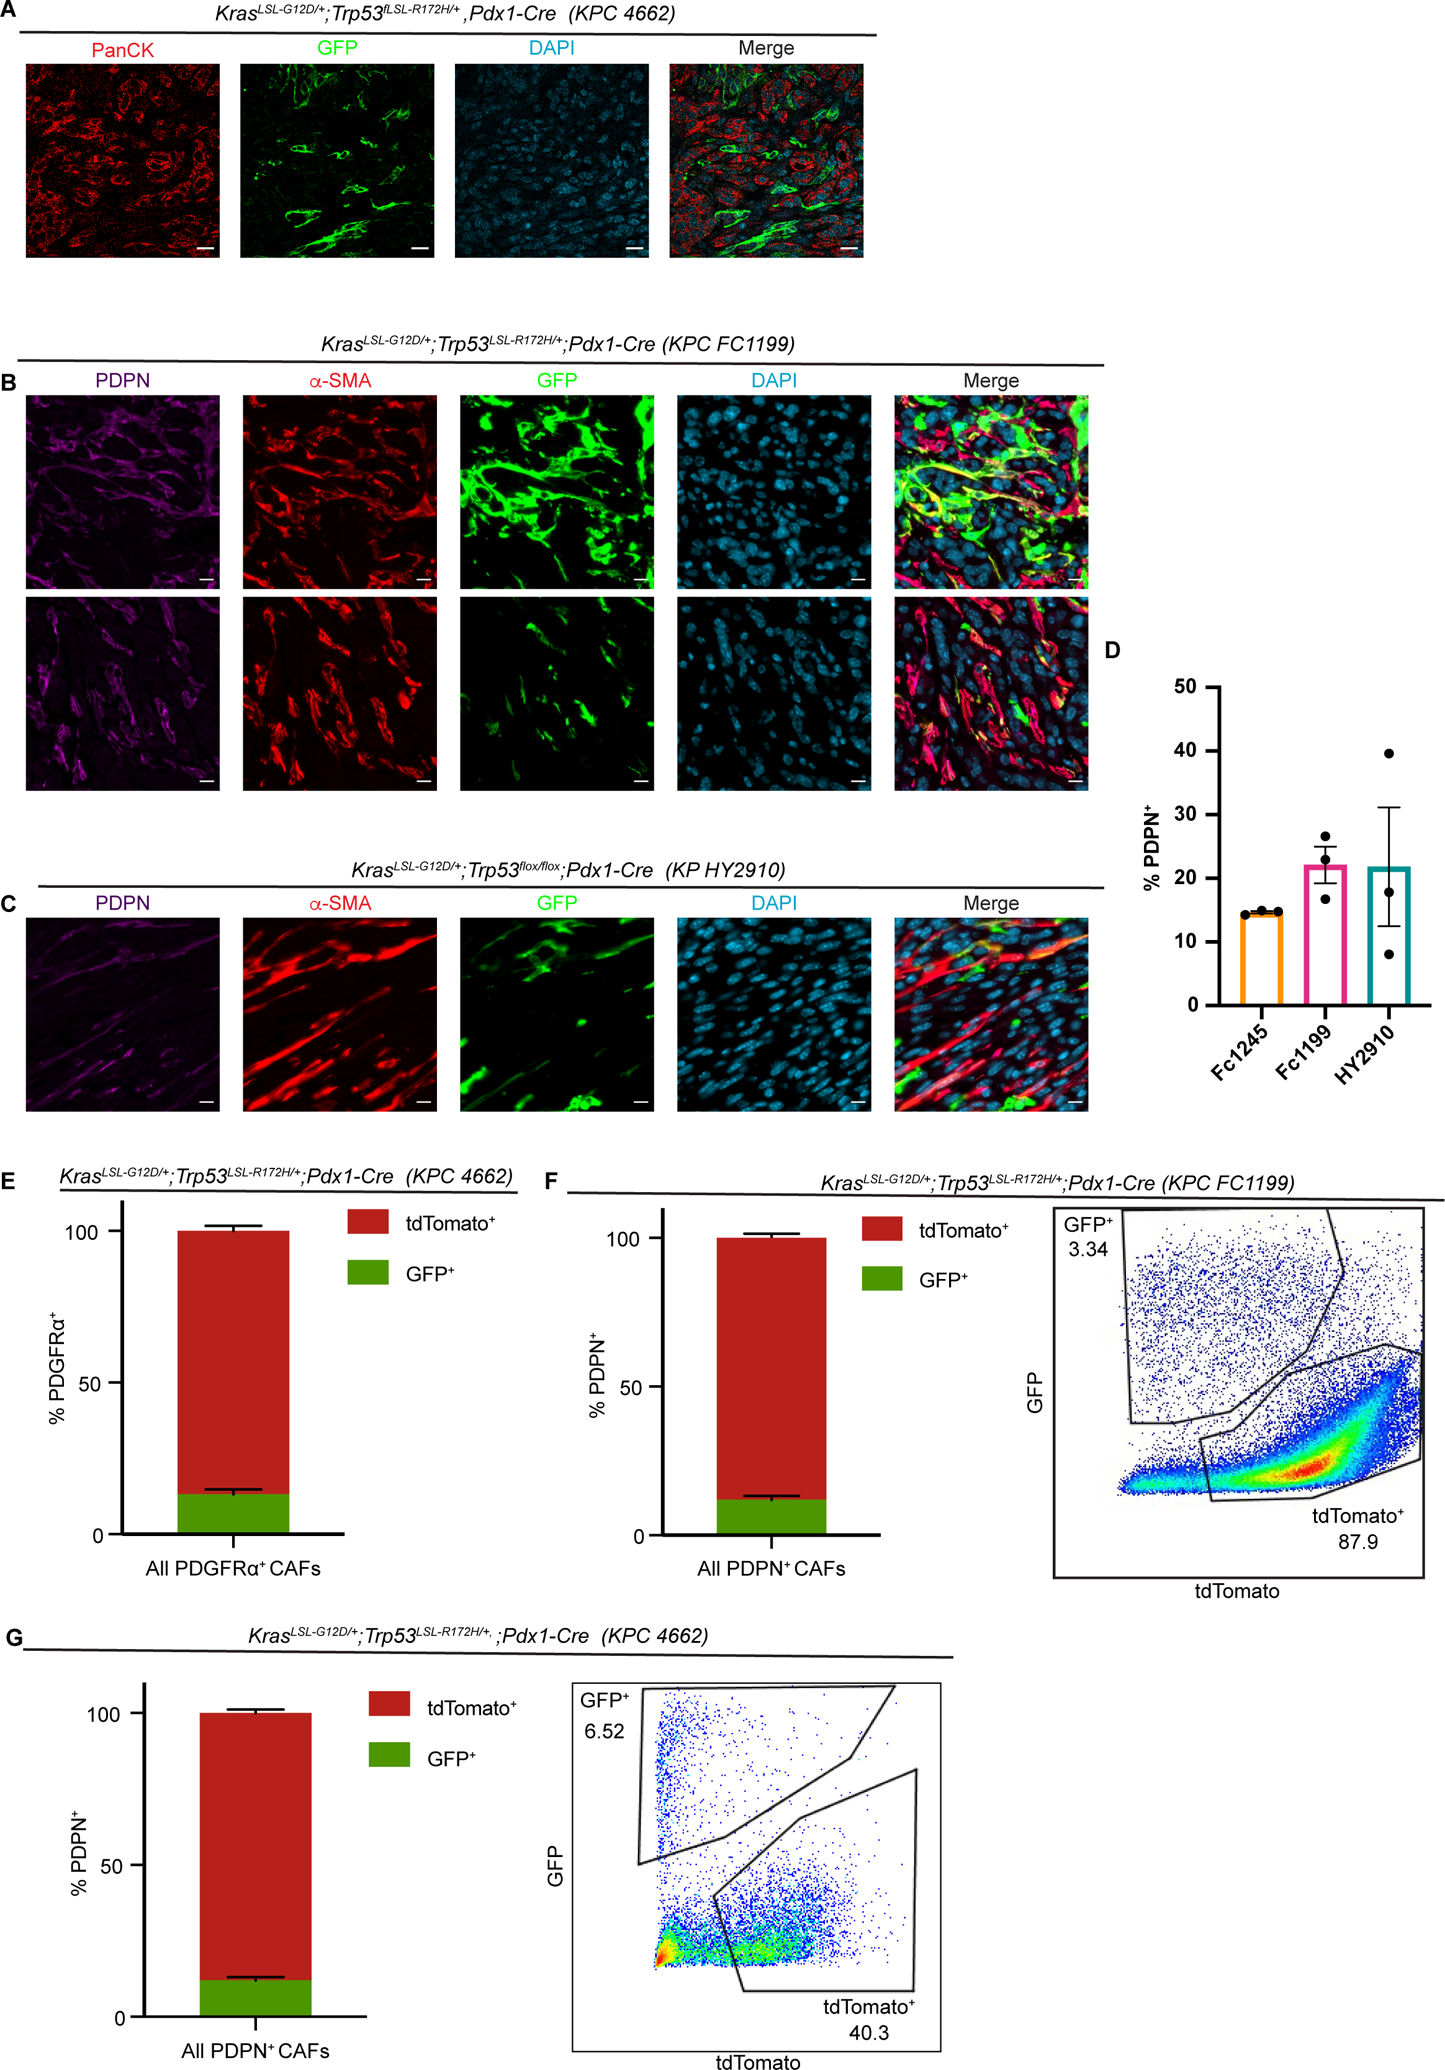
Figure 2. Stellate cells give rise to a numerically minor subset of PDAC CAFs.

(A) Immunohistochemical staining of PDAC (KPC 4662) in Fabp4-Cre;Rosa26mTmG hosts (n = 5), with GFP in green and panCK (tumor cells) in red. Scale bar = 20 μm. (B) Immunohistochemical staining of PDAC (KPC FC1199) in Fabp4-Cre;Rosa26mTmG hosts (n = 3), stained for GFP, PDPN, and α-SMA. Scale bar = 10 μm. (C) Immunohistochemical staining of PDAC (KPflox/+C HY2910) in Fabp4-Cre;Rosa26mTmG hosts (n = 3), stained for GFP, PDPN, and α-SMA. Scale bar = 10 μm. (D) Quantification of immunohistochemical staining for PDPN in the indicated transplantable PDAC models. (E) Flow cytometry analysis of PDGFRα, GFP, and tdTomato in KPC 4662 tumors in Fabp4-Cre;Rosa26mTmG hosts (n = 5). Data are presented as mean ± SEM. For E-G, CAF frequency calculations excluded the tdTomato−GFP− fraction constituting transplanted PDAC cells. (F) Flow cytometry analysis of PDPN, GFP, and tdTomato in KPC FC1199 tumors in Fabp4-Cre;Rosa26mTmG hosts (n = 8). Data are presented as mean ± SEM. (G) Flow cytometry analysis of PDPN, GFP, and tdTomato in KPC 4662 tumors in Fabp4-Cre;Rosa26mTmG hosts (n = 3). Data are presented as mean ± SEM.
